Bermudan vs Immigrants from Austria Currently Married
COMPARE
Bermudan
Immigrants from Austria
Currently Married
Currently Married Comparison
Bermudans
Immigrants from Austria
43.5%
CURRENTLY MARRIED
0.1/ 100
METRIC RATING
271st/ 347
METRIC RANK
48.5%
CURRENTLY MARRIED
98.8/ 100
METRIC RATING
53rd/ 347
METRIC RANK
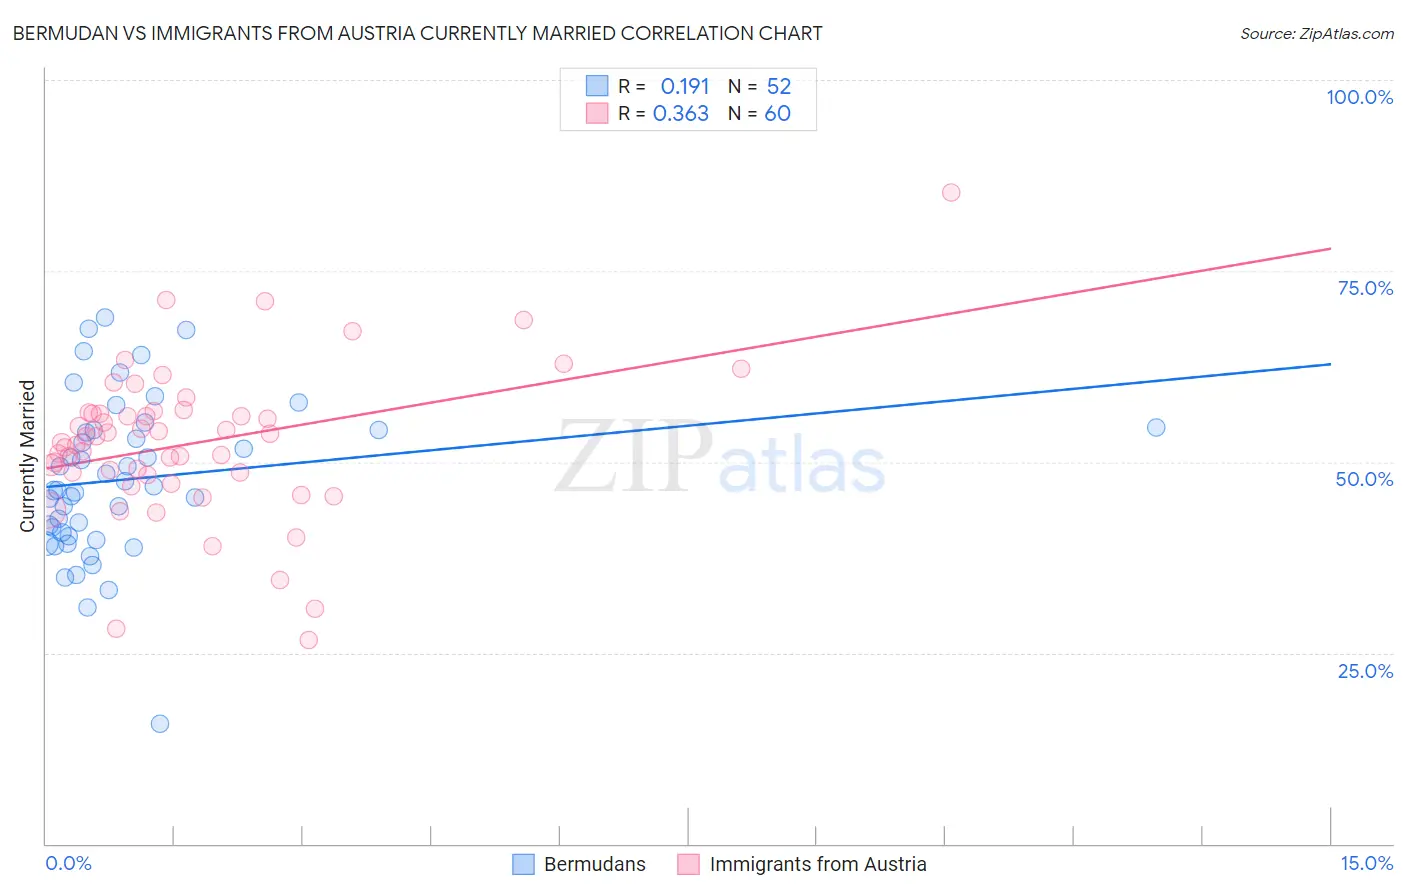
Bermudan vs Immigrants from Austria Currently Married Correlation Chart
The statistical analysis conducted on geographies consisting of 55,732,325 people shows a poor positive correlation between the proportion of Bermudans and percentage of population currently married in the United States with a correlation coefficient (R) of 0.191 and weighted average of 43.5%. Similarly, the statistical analysis conducted on geographies consisting of 167,972,759 people shows a mild positive correlation between the proportion of Immigrants from Austria and percentage of population currently married in the United States with a correlation coefficient (R) of 0.363 and weighted average of 48.5%, a difference of 11.5%.
Currently Married Correlation Summary
| Measurement | Bermudan | Immigrants from Austria |
| Minimum | 15.7% | 26.6% |
| Maximum | 68.9% | 85.3% |
| Range | 53.2% | 58.7% |
| Mean | 47.7% | 52.5% |
| Median | 46.6% | 52.9% |
| Interquartile 25% (IQ1) | 40.5% | 48.4% |
| Interquartile 75% (IQ3) | 54.2% | 56.4% |
| Interquartile Range (IQR) | 13.7% | 8.0% |
| Standard Deviation (Sample) | 10.4% | 10.0% |
| Standard Deviation (Population) | 10.3% | 9.9% |
Similar Demographics by Currently Married
Demographics Similar to Bermudans by Currently Married
In terms of currently married, the demographic groups most similar to Bermudans are Salvadoran (43.5%, a difference of 0.020%), Indonesian (43.5%, a difference of 0.040%), Yaqui (43.4%, a difference of 0.080%), Immigrants from Sudan (43.5%, a difference of 0.090%), and Nigerian (43.4%, a difference of 0.10%).
| Demographics | Rating | Rank | Currently Married |
| Sudanese | 0.1 /100 | #264 | Tragic 43.7% |
| Immigrants | Bangladesh | 0.1 /100 | #265 | Tragic 43.6% |
| Ecuadorians | 0.1 /100 | #266 | Tragic 43.6% |
| Immigrants | Eritrea | 0.1 /100 | #267 | Tragic 43.6% |
| Spanish American Indians | 0.1 /100 | #268 | Tragic 43.6% |
| Immigrants | Sudan | 0.1 /100 | #269 | Tragic 43.5% |
| Salvadorans | 0.1 /100 | #270 | Tragic 43.5% |
| Bermudans | 0.1 /100 | #271 | Tragic 43.5% |
| Indonesians | 0.1 /100 | #272 | Tragic 43.5% |
| Yaqui | 0.1 /100 | #273 | Tragic 43.4% |
| Nigerians | 0.1 /100 | #274 | Tragic 43.4% |
| Colville | 0.1 /100 | #275 | Tragic 43.4% |
| Sierra Leoneans | 0.1 /100 | #276 | Tragic 43.4% |
| Immigrants | Nigeria | 0.1 /100 | #277 | Tragic 43.4% |
| Central Americans | 0.0 /100 | #278 | Tragic 43.3% |
Demographics Similar to Immigrants from Austria by Currently Married
In terms of currently married, the demographic groups most similar to Immigrants from Austria are Immigrants from Moldova (48.5%, a difference of 0.060%), Immigrants from North Macedonia (48.5%, a difference of 0.070%), Latvian (48.5%, a difference of 0.070%), Immigrants from Netherlands (48.5%, a difference of 0.10%), and Russian (48.6%, a difference of 0.12%).
| Demographics | Rating | Rank | Currently Married |
| Immigrants | Iran | 99.2 /100 | #46 | Exceptional 48.7% |
| Northern Europeans | 99.2 /100 | #47 | Exceptional 48.7% |
| Austrians | 99.2 /100 | #48 | Exceptional 48.7% |
| Bhutanese | 99.1 /100 | #49 | Exceptional 48.6% |
| Iranians | 99.0 /100 | #50 | Exceptional 48.6% |
| Whites/Caucasians | 99.0 /100 | #51 | Exceptional 48.6% |
| Russians | 98.9 /100 | #52 | Exceptional 48.6% |
| Immigrants | Austria | 98.8 /100 | #53 | Exceptional 48.5% |
| Immigrants | Moldova | 98.7 /100 | #54 | Exceptional 48.5% |
| Immigrants | North Macedonia | 98.7 /100 | #55 | Exceptional 48.5% |
| Latvians | 98.7 /100 | #56 | Exceptional 48.5% |
| Immigrants | Netherlands | 98.6 /100 | #57 | Exceptional 48.5% |
| French | 98.6 /100 | #58 | Exceptional 48.4% |
| Immigrants | Ireland | 98.5 /100 | #59 | Exceptional 48.4% |
| Immigrants | Romania | 98.5 /100 | #60 | Exceptional 48.4% |