Chinese vs Ugandan Currently Married
COMPARE
Chinese
Ugandan
Currently Married
Currently Married Comparison
Chinese
Ugandans
49.5%
CURRENTLY MARRIED
99.9/ 100
METRIC RATING
16th/ 347
METRIC RANK
44.2%
CURRENTLY MARRIED
0.4/ 100
METRIC RATING
247th/ 347
METRIC RANK
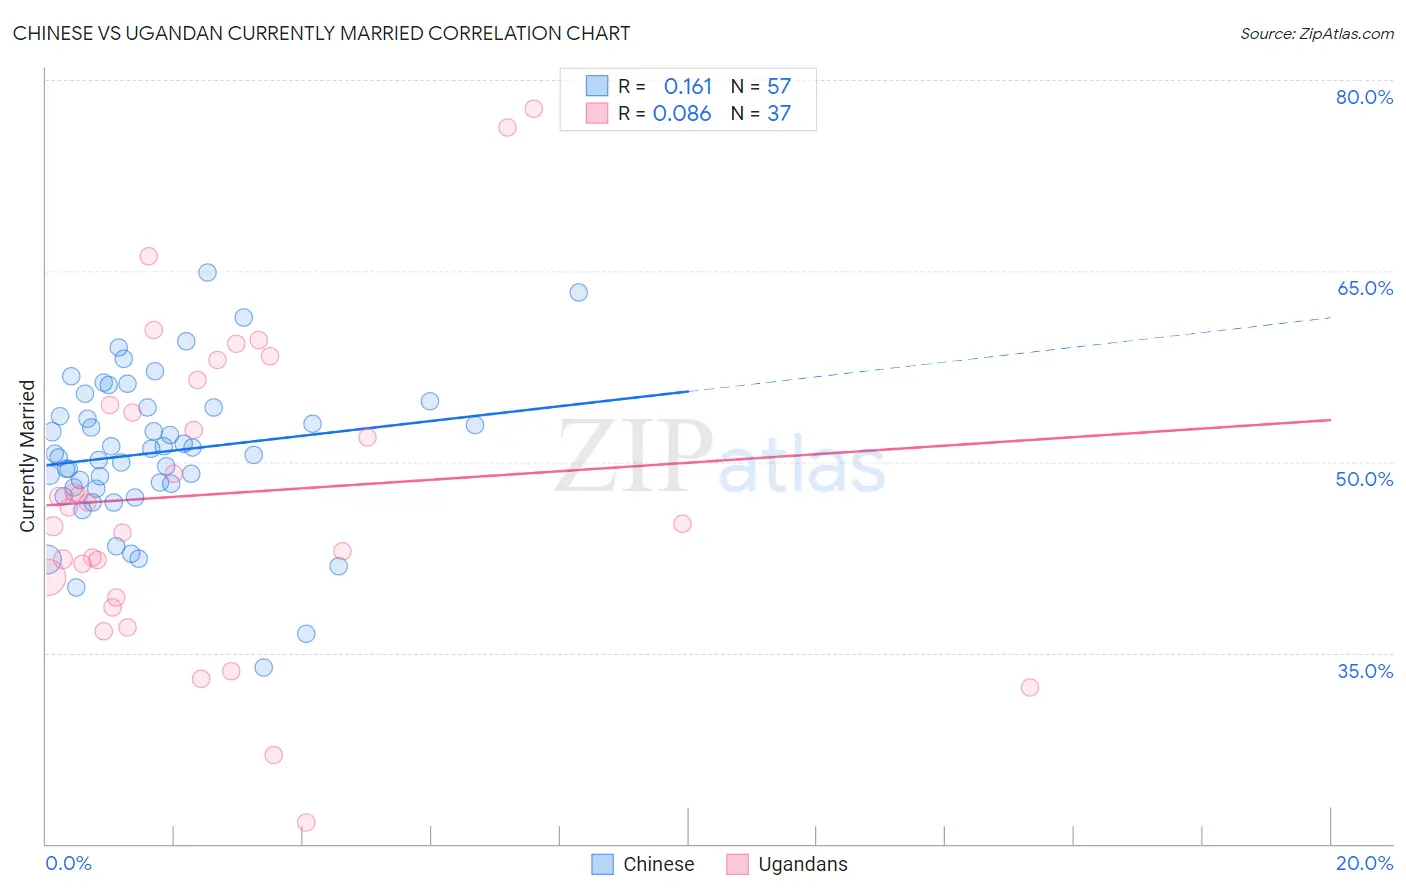
Chinese vs Ugandan Currently Married Correlation Chart
The statistical analysis conducted on geographies consisting of 64,808,439 people shows a poor positive correlation between the proportion of Chinese and percentage of population currently married in the United States with a correlation coefficient (R) of 0.161 and weighted average of 49.5%. Similarly, the statistical analysis conducted on geographies consisting of 94,016,399 people shows a slight positive correlation between the proportion of Ugandans and percentage of population currently married in the United States with a correlation coefficient (R) of 0.086 and weighted average of 44.2%, a difference of 11.9%.
Currently Married Correlation Summary
| Measurement | Chinese | Ugandan |
| Minimum | 33.8% | 21.7% |
| Maximum | 64.9% | 77.7% |
| Range | 31.1% | 56.0% |
| Mean | 50.7% | 47.5% |
| Median | 50.7% | 46.4% |
| Interquartile 25% (IQ1) | 47.9% | 40.1% |
| Interquartile 75% (IQ3) | 54.3% | 55.4% |
| Interquartile Range (IQR) | 6.4% | 15.3% |
| Standard Deviation (Sample) | 6.0% | 12.1% |
| Standard Deviation (Population) | 5.9% | 11.9% |
Similar Demographics by Currently Married
Demographics Similar to Chinese by Currently Married
In terms of currently married, the demographic groups most similar to Chinese are Scandinavian (49.5%, a difference of 0.020%), Pennsylvania German (49.6%, a difference of 0.14%), German (49.6%, a difference of 0.17%), Dutch (49.6%, a difference of 0.18%), and Immigrants from Scotland (49.3%, a difference of 0.31%).
| Demographics | Rating | Rank | Currently Married |
| Czechs | 99.9 /100 | #9 | Exceptional 49.9% |
| Filipinos | 99.9 /100 | #10 | Exceptional 49.7% |
| English | 99.9 /100 | #11 | Exceptional 49.7% |
| Swiss | 99.9 /100 | #12 | Exceptional 49.7% |
| Dutch | 99.9 /100 | #13 | Exceptional 49.6% |
| Germans | 99.9 /100 | #14 | Exceptional 49.6% |
| Pennsylvania Germans | 99.9 /100 | #15 | Exceptional 49.6% |
| Chinese | 99.9 /100 | #16 | Exceptional 49.5% |
| Scandinavians | 99.9 /100 | #17 | Exceptional 49.5% |
| Immigrants | Scotland | 99.8 /100 | #18 | Exceptional 49.3% |
| Europeans | 99.8 /100 | #19 | Exceptional 49.3% |
| Luxembourgers | 99.8 /100 | #20 | Exceptional 49.3% |
| Scottish | 99.8 /100 | #21 | Exceptional 49.2% |
| Bulgarians | 99.7 /100 | #22 | Exceptional 49.1% |
| Immigrants | Pakistan | 99.7 /100 | #23 | Exceptional 49.1% |
Demographics Similar to Ugandans by Currently Married
In terms of currently married, the demographic groups most similar to Ugandans are Nicaraguan (44.2%, a difference of 0.090%), Immigrants from Cameroon (44.2%, a difference of 0.10%), Immigrants from Eastern Africa (44.2%, a difference of 0.12%), Immigrants from Burma/Myanmar (44.3%, a difference of 0.13%), and Blackfeet (44.2%, a difference of 0.19%).
| Demographics | Rating | Rank | Currently Married |
| Mexican American Indians | 0.7 /100 | #240 | Tragic 44.5% |
| Ethiopians | 0.7 /100 | #241 | Tragic 44.5% |
| Immigrants | Cambodia | 0.7 /100 | #242 | Tragic 44.5% |
| Immigrants | Ethiopia | 0.7 /100 | #243 | Tragic 44.5% |
| Japanese | 0.6 /100 | #244 | Tragic 44.5% |
| Immigrants | Armenia | 0.4 /100 | #245 | Tragic 44.3% |
| Immigrants | Burma/Myanmar | 0.4 /100 | #246 | Tragic 44.3% |
| Ugandans | 0.4 /100 | #247 | Tragic 44.2% |
| Nicaraguans | 0.3 /100 | #248 | Tragic 44.2% |
| Immigrants | Cameroon | 0.3 /100 | #249 | Tragic 44.2% |
| Immigrants | Eastern Africa | 0.3 /100 | #250 | Tragic 44.2% |
| Blackfeet | 0.3 /100 | #251 | Tragic 44.2% |
| Hispanics or Latinos | 0.3 /100 | #252 | Tragic 44.1% |
| Immigrants | Central America | 0.3 /100 | #253 | Tragic 44.1% |
| Vietnamese | 0.2 /100 | #254 | Tragic 44.0% |