Chinese vs Ukrainian Currently Married
COMPARE
Chinese
Ukrainian
Currently Married
Currently Married Comparison
Chinese
Ukrainians
49.5%
CURRENTLY MARRIED
99.9/ 100
METRIC RATING
16th/ 347
METRIC RANK
48.4%
CURRENTLY MARRIED
98.3/ 100
METRIC RATING
65th/ 347
METRIC RANK
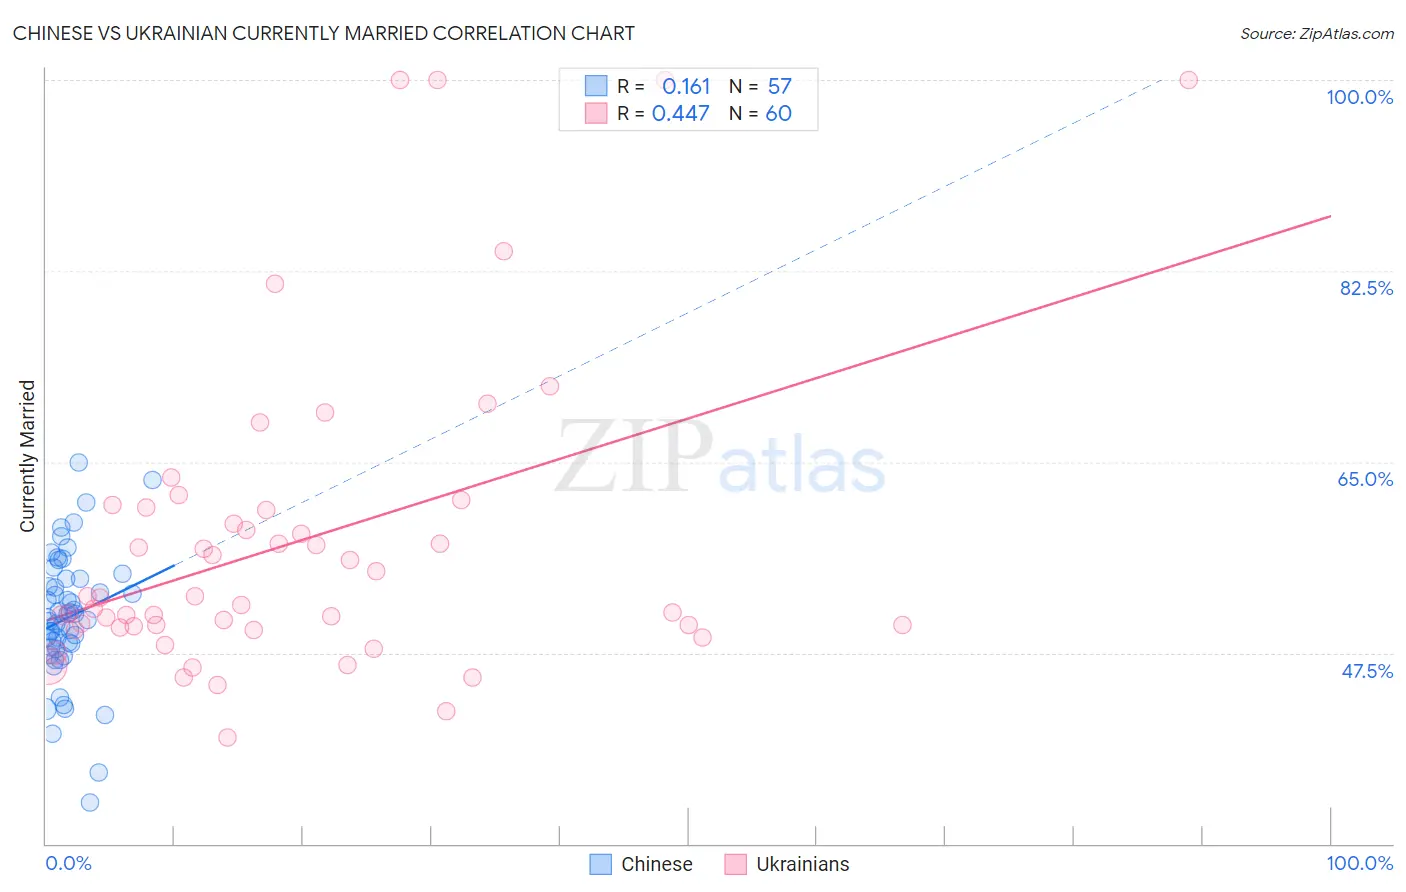
Chinese vs Ukrainian Currently Married Correlation Chart
The statistical analysis conducted on geographies consisting of 64,808,439 people shows a poor positive correlation between the proportion of Chinese and percentage of population currently married in the United States with a correlation coefficient (R) of 0.161 and weighted average of 49.5%. Similarly, the statistical analysis conducted on geographies consisting of 448,616,463 people shows a moderate positive correlation between the proportion of Ukrainians and percentage of population currently married in the United States with a correlation coefficient (R) of 0.447 and weighted average of 48.4%, a difference of 2.4%.
Currently Married Correlation Summary
| Measurement | Chinese | Ukrainian |
| Minimum | 33.8% | 39.7% |
| Maximum | 64.9% | 100.0% |
| Range | 31.1% | 60.3% |
| Mean | 50.7% | 57.7% |
| Median | 50.7% | 52.3% |
| Interquartile 25% (IQ1) | 47.9% | 49.9% |
| Interquartile 75% (IQ3) | 54.3% | 60.7% |
| Interquartile Range (IQR) | 6.4% | 10.8% |
| Standard Deviation (Sample) | 6.0% | 14.2% |
| Standard Deviation (Population) | 5.9% | 14.1% |
Similar Demographics by Currently Married
Demographics Similar to Chinese by Currently Married
In terms of currently married, the demographic groups most similar to Chinese are Scandinavian (49.5%, a difference of 0.020%), Pennsylvania German (49.6%, a difference of 0.14%), German (49.6%, a difference of 0.17%), Dutch (49.6%, a difference of 0.18%), and Immigrants from Scotland (49.3%, a difference of 0.31%).
| Demographics | Rating | Rank | Currently Married |
| Czechs | 99.9 /100 | #9 | Exceptional 49.9% |
| Filipinos | 99.9 /100 | #10 | Exceptional 49.7% |
| English | 99.9 /100 | #11 | Exceptional 49.7% |
| Swiss | 99.9 /100 | #12 | Exceptional 49.7% |
| Dutch | 99.9 /100 | #13 | Exceptional 49.6% |
| Germans | 99.9 /100 | #14 | Exceptional 49.6% |
| Pennsylvania Germans | 99.9 /100 | #15 | Exceptional 49.6% |
| Chinese | 99.9 /100 | #16 | Exceptional 49.5% |
| Scandinavians | 99.9 /100 | #17 | Exceptional 49.5% |
| Immigrants | Scotland | 99.8 /100 | #18 | Exceptional 49.3% |
| Europeans | 99.8 /100 | #19 | Exceptional 49.3% |
| Luxembourgers | 99.8 /100 | #20 | Exceptional 49.3% |
| Scottish | 99.8 /100 | #21 | Exceptional 49.2% |
| Bulgarians | 99.7 /100 | #22 | Exceptional 49.1% |
| Immigrants | Pakistan | 99.7 /100 | #23 | Exceptional 49.1% |
Demographics Similar to Ukrainians by Currently Married
In terms of currently married, the demographic groups most similar to Ukrainians are Slavic (48.4%, a difference of 0.010%), Immigrants from Czechoslovakia (48.4%, a difference of 0.010%), Tongan (48.3%, a difference of 0.030%), Slovak (48.3%, a difference of 0.040%), and Immigrants from England (48.3%, a difference of 0.050%).
| Demographics | Rating | Rank | Currently Married |
| French | 98.6 /100 | #58 | Exceptional 48.4% |
| Immigrants | Ireland | 98.5 /100 | #59 | Exceptional 48.4% |
| Immigrants | Romania | 98.5 /100 | #60 | Exceptional 48.4% |
| Romanians | 98.5 /100 | #61 | Exceptional 48.4% |
| Asians | 98.5 /100 | #62 | Exceptional 48.4% |
| Slavs | 98.3 /100 | #63 | Exceptional 48.4% |
| Immigrants | Czechoslovakia | 98.3 /100 | #64 | Exceptional 48.4% |
| Ukrainians | 98.3 /100 | #65 | Exceptional 48.4% |
| Tongans | 98.2 /100 | #66 | Exceptional 48.3% |
| Slovaks | 98.2 /100 | #67 | Exceptional 48.3% |
| Immigrants | England | 98.2 /100 | #68 | Exceptional 48.3% |
| Canadians | 98.1 /100 | #69 | Exceptional 48.3% |
| Immigrants | Asia | 97.9 /100 | #70 | Exceptional 48.3% |
| Macedonians | 97.9 /100 | #71 | Exceptional 48.3% |
| Immigrants | Lebanon | 97.6 /100 | #72 | Exceptional 48.2% |