Chickasaw vs Welsh Single Mother Households
COMPARE
Chickasaw
Welsh
Single Mother Households
Single Mother Households Comparison
Chickasaw
Welsh
7.0%
SINGLE MOTHER HOUSEHOLDS
1.4/ 100
METRIC RATING
234th/ 347
METRIC RANK
5.9%
SINGLE MOTHER HOUSEHOLDS
92.8/ 100
METRIC RATING
126th/ 347
METRIC RANK
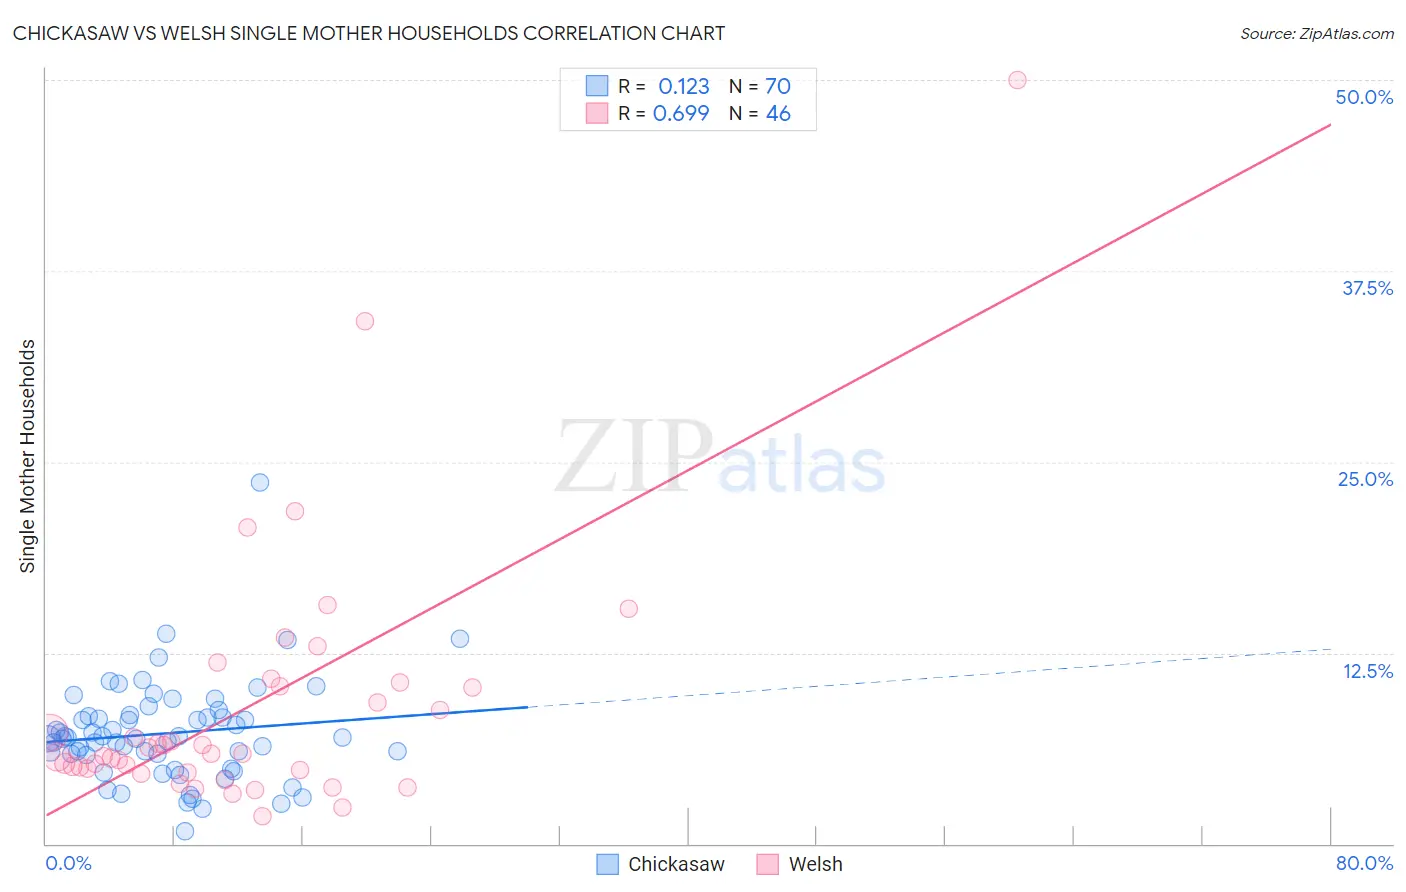
Chickasaw vs Welsh Single Mother Households Correlation Chart
The statistical analysis conducted on geographies consisting of 147,547,774 people shows a poor positive correlation between the proportion of Chickasaw and percentage of single mother households in the United States with a correlation coefficient (R) of 0.123 and weighted average of 7.0%. Similarly, the statistical analysis conducted on geographies consisting of 524,967,910 people shows a significant positive correlation between the proportion of Welsh and percentage of single mother households in the United States with a correlation coefficient (R) of 0.699 and weighted average of 5.9%, a difference of 20.0%.
Single Mother Households Correlation Summary
| Measurement | Chickasaw | Welsh |
| Minimum | 0.84% | 1.8% |
| Maximum | 23.7% | 50.0% |
| Range | 22.8% | 48.2% |
| Mean | 7.2% | 9.0% |
| Median | 6.9% | 5.9% |
| Interquartile 25% (IQ1) | 5.8% | 4.8% |
| Interquartile 75% (IQ3) | 8.3% | 10.3% |
| Interquartile Range (IQR) | 2.5% | 5.5% |
| Standard Deviation (Sample) | 3.3% | 8.6% |
| Standard Deviation (Population) | 3.3% | 8.5% |
Similar Demographics by Single Mother Households
Demographics Similar to Chickasaw by Single Mother Households
In terms of single mother households, the demographic groups most similar to Chickasaw are Choctaw (7.0%, a difference of 0.020%), Immigrants from Burma/Myanmar (7.0%, a difference of 0.070%), Comanche (7.0%, a difference of 0.19%), Spanish American (7.0%, a difference of 0.25%), and Creek (7.0%, a difference of 0.27%).
| Demographics | Rating | Rank | Single Mother Households |
| Kenyans | 2.3 /100 | #227 | Tragic 7.0% |
| Iroquois | 2.2 /100 | #228 | Tragic 7.0% |
| Immigrants | Kenya | 2.1 /100 | #229 | Tragic 7.0% |
| Creek | 1.6 /100 | #230 | Tragic 7.0% |
| Spanish Americans | 1.6 /100 | #231 | Tragic 7.0% |
| Comanche | 1.5 /100 | #232 | Tragic 7.0% |
| Choctaw | 1.4 /100 | #233 | Tragic 7.0% |
| Chickasaw | 1.4 /100 | #234 | Tragic 7.0% |
| Immigrants | Burma/Myanmar | 1.4 /100 | #235 | Tragic 7.0% |
| Ute | 1.0 /100 | #236 | Tragic 7.1% |
| Arapaho | 1.0 /100 | #237 | Tragic 7.1% |
| Panamanians | 0.9 /100 | #238 | Tragic 7.1% |
| Kiowa | 0.8 /100 | #239 | Tragic 7.1% |
| Immigrants | Panama | 0.7 /100 | #240 | Tragic 7.2% |
| Immigrants | Portugal | 0.6 /100 | #241 | Tragic 7.2% |
Demographics Similar to Welsh by Single Mother Households
In terms of single mother households, the demographic groups most similar to Welsh are Slavic (5.9%, a difference of 0.020%), Immigrants from Argentina (5.9%, a difference of 0.18%), Lebanese (5.9%, a difference of 0.19%), Immigrants from Uzbekistan (5.9%, a difference of 0.25%), and Czechoslovakian (5.9%, a difference of 0.27%).
| Demographics | Rating | Rank | Single Mother Households |
| South Africans | 94.1 /100 | #119 | Exceptional 5.8% |
| Tongans | 93.7 /100 | #120 | Exceptional 5.8% |
| Argentineans | 93.7 /100 | #121 | Exceptional 5.8% |
| Belgians | 93.5 /100 | #122 | Exceptional 5.8% |
| Immigrants | Uzbekistan | 93.4 /100 | #123 | Exceptional 5.9% |
| Immigrants | Argentina | 93.2 /100 | #124 | Exceptional 5.9% |
| Slavs | 92.9 /100 | #125 | Exceptional 5.9% |
| Welsh | 92.8 /100 | #126 | Exceptional 5.9% |
| Lebanese | 92.4 /100 | #127 | Exceptional 5.9% |
| Czechoslovakians | 92.2 /100 | #128 | Exceptional 5.9% |
| Immigrants | Bolivia | 92.2 /100 | #129 | Exceptional 5.9% |
| Palestinians | 92.1 /100 | #130 | Exceptional 5.9% |
| Immigrants | Spain | 91.2 /100 | #131 | Exceptional 5.9% |
| Albanians | 91.1 /100 | #132 | Exceptional 5.9% |
| Egyptians | 90.7 /100 | #133 | Exceptional 5.9% |