Chickasaw vs Sierra Leonean Single Mother Households
COMPARE
Chickasaw
Sierra Leonean
Single Mother Households
Single Mother Households Comparison
Chickasaw
Sierra Leoneans
7.0%
SINGLE MOTHER HOUSEHOLDS
1.4/ 100
METRIC RATING
234th/ 347
METRIC RANK
7.7%
SINGLE MOTHER HOUSEHOLDS
0.0/ 100
METRIC RATING
288th/ 347
METRIC RANK
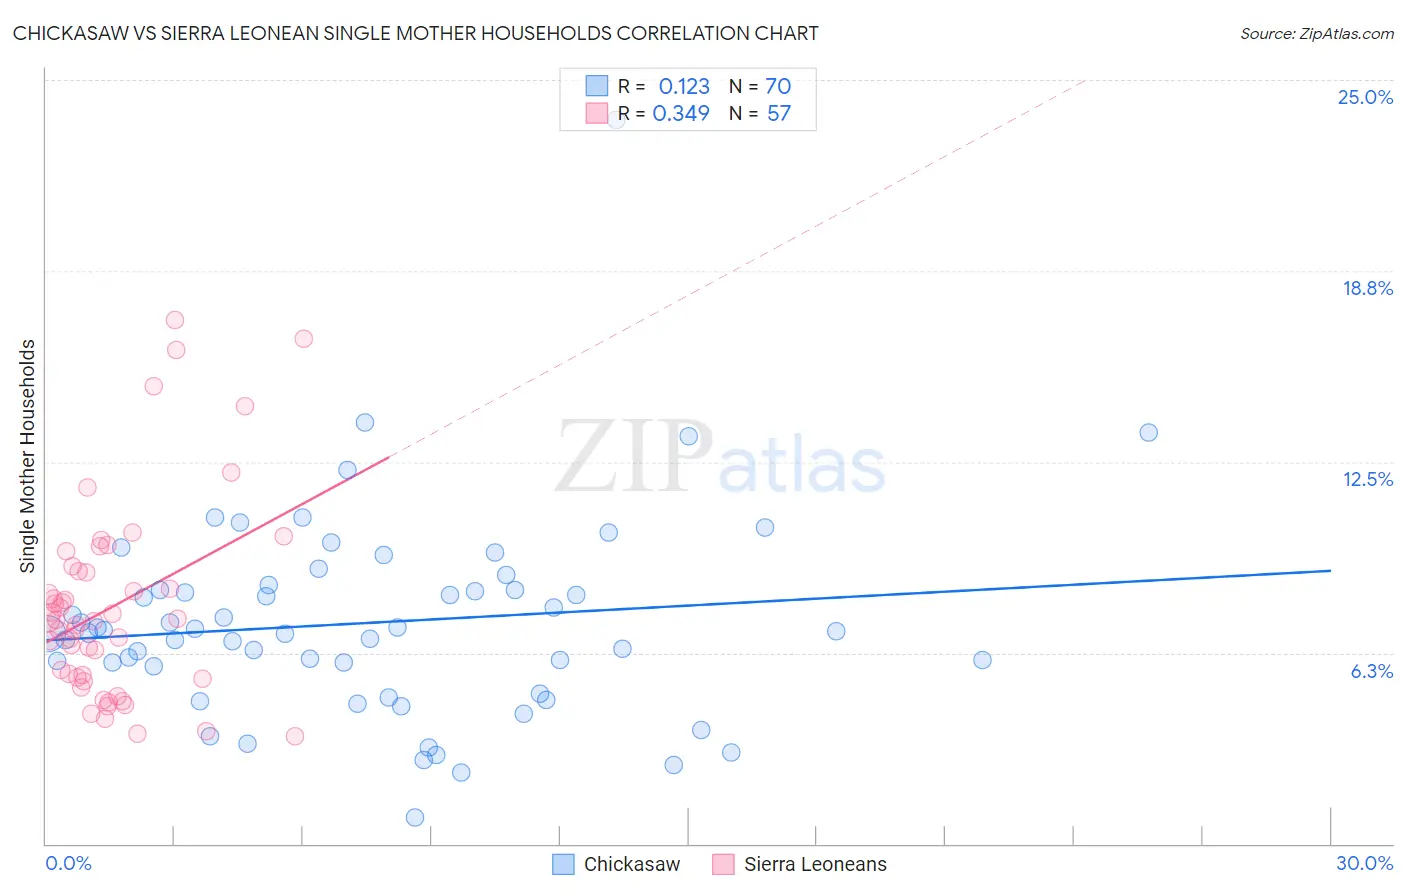
Chickasaw vs Sierra Leonean Single Mother Households Correlation Chart
The statistical analysis conducted on geographies consisting of 147,547,774 people shows a poor positive correlation between the proportion of Chickasaw and percentage of single mother households in the United States with a correlation coefficient (R) of 0.123 and weighted average of 7.0%. Similarly, the statistical analysis conducted on geographies consisting of 83,310,522 people shows a mild positive correlation between the proportion of Sierra Leoneans and percentage of single mother households in the United States with a correlation coefficient (R) of 0.349 and weighted average of 7.7%, a difference of 9.8%.
Single Mother Households Correlation Summary
| Measurement | Chickasaw | Sierra Leonean |
| Minimum | 0.84% | 3.5% |
| Maximum | 23.7% | 17.1% |
| Range | 22.8% | 13.6% |
| Mean | 7.2% | 7.8% |
| Median | 6.9% | 7.3% |
| Interquartile 25% (IQ1) | 5.8% | 5.4% |
| Interquartile 75% (IQ3) | 8.3% | 9.0% |
| Interquartile Range (IQR) | 2.5% | 3.6% |
| Standard Deviation (Sample) | 3.3% | 3.2% |
| Standard Deviation (Population) | 3.3% | 3.2% |
Similar Demographics by Single Mother Households
Demographics Similar to Chickasaw by Single Mother Households
In terms of single mother households, the demographic groups most similar to Chickasaw are Choctaw (7.0%, a difference of 0.020%), Immigrants from Burma/Myanmar (7.0%, a difference of 0.070%), Comanche (7.0%, a difference of 0.19%), Spanish American (7.0%, a difference of 0.25%), and Creek (7.0%, a difference of 0.27%).
| Demographics | Rating | Rank | Single Mother Households |
| Kenyans | 2.3 /100 | #227 | Tragic 7.0% |
| Iroquois | 2.2 /100 | #228 | Tragic 7.0% |
| Immigrants | Kenya | 2.1 /100 | #229 | Tragic 7.0% |
| Creek | 1.6 /100 | #230 | Tragic 7.0% |
| Spanish Americans | 1.6 /100 | #231 | Tragic 7.0% |
| Comanche | 1.5 /100 | #232 | Tragic 7.0% |
| Choctaw | 1.4 /100 | #233 | Tragic 7.0% |
| Chickasaw | 1.4 /100 | #234 | Tragic 7.0% |
| Immigrants | Burma/Myanmar | 1.4 /100 | #235 | Tragic 7.0% |
| Ute | 1.0 /100 | #236 | Tragic 7.1% |
| Arapaho | 1.0 /100 | #237 | Tragic 7.1% |
| Panamanians | 0.9 /100 | #238 | Tragic 7.1% |
| Kiowa | 0.8 /100 | #239 | Tragic 7.1% |
| Immigrants | Panama | 0.7 /100 | #240 | Tragic 7.2% |
| Immigrants | Portugal | 0.6 /100 | #241 | Tragic 7.2% |
Demographics Similar to Sierra Leoneans by Single Mother Households
In terms of single mother households, the demographic groups most similar to Sierra Leoneans are Immigrants from Guatemala (7.7%, a difference of 0.050%), Immigrants from Middle Africa (7.7%, a difference of 0.15%), Trinidadian and Tobagonian (7.7%, a difference of 0.26%), Immigrants from Belize (7.7%, a difference of 0.29%), and Nigerian (7.7%, a difference of 0.89%).
| Demographics | Rating | Rank | Single Mother Households |
| Immigrants | Laos | 0.0 /100 | #281 | Tragic 7.7% |
| Guatemalans | 0.0 /100 | #282 | Tragic 7.7% |
| Nigerians | 0.0 /100 | #283 | Tragic 7.7% |
| Immigrants | Belize | 0.0 /100 | #284 | Tragic 7.7% |
| Trinidadians and Tobagonians | 0.0 /100 | #285 | Tragic 7.7% |
| Immigrants | Middle Africa | 0.0 /100 | #286 | Tragic 7.7% |
| Immigrants | Guatemala | 0.0 /100 | #287 | Tragic 7.7% |
| Sierra Leoneans | 0.0 /100 | #288 | Tragic 7.7% |
| Sub-Saharan Africans | 0.0 /100 | #289 | Tragic 7.8% |
| Immigrants | Nigeria | 0.0 /100 | #290 | Tragic 7.8% |
| West Indians | 0.0 /100 | #291 | Tragic 7.8% |
| Ghanaians | 0.0 /100 | #292 | Tragic 7.8% |
| Immigrants | Cameroon | 0.0 /100 | #293 | Tragic 7.9% |
| Apache | 0.0 /100 | #294 | Tragic 7.9% |
| Barbadians | 0.0 /100 | #295 | Tragic 7.9% |