Yaqui vs Welsh Single Mother Households
COMPARE
Yaqui
Welsh
Single Mother Households
Single Mother Households Comparison
Yaqui
Welsh
7.4%
SINGLE MOTHER HOUSEHOLDS
0.1/ 100
METRIC RATING
264th/ 347
METRIC RANK
5.9%
SINGLE MOTHER HOUSEHOLDS
92.8/ 100
METRIC RATING
126th/ 347
METRIC RANK
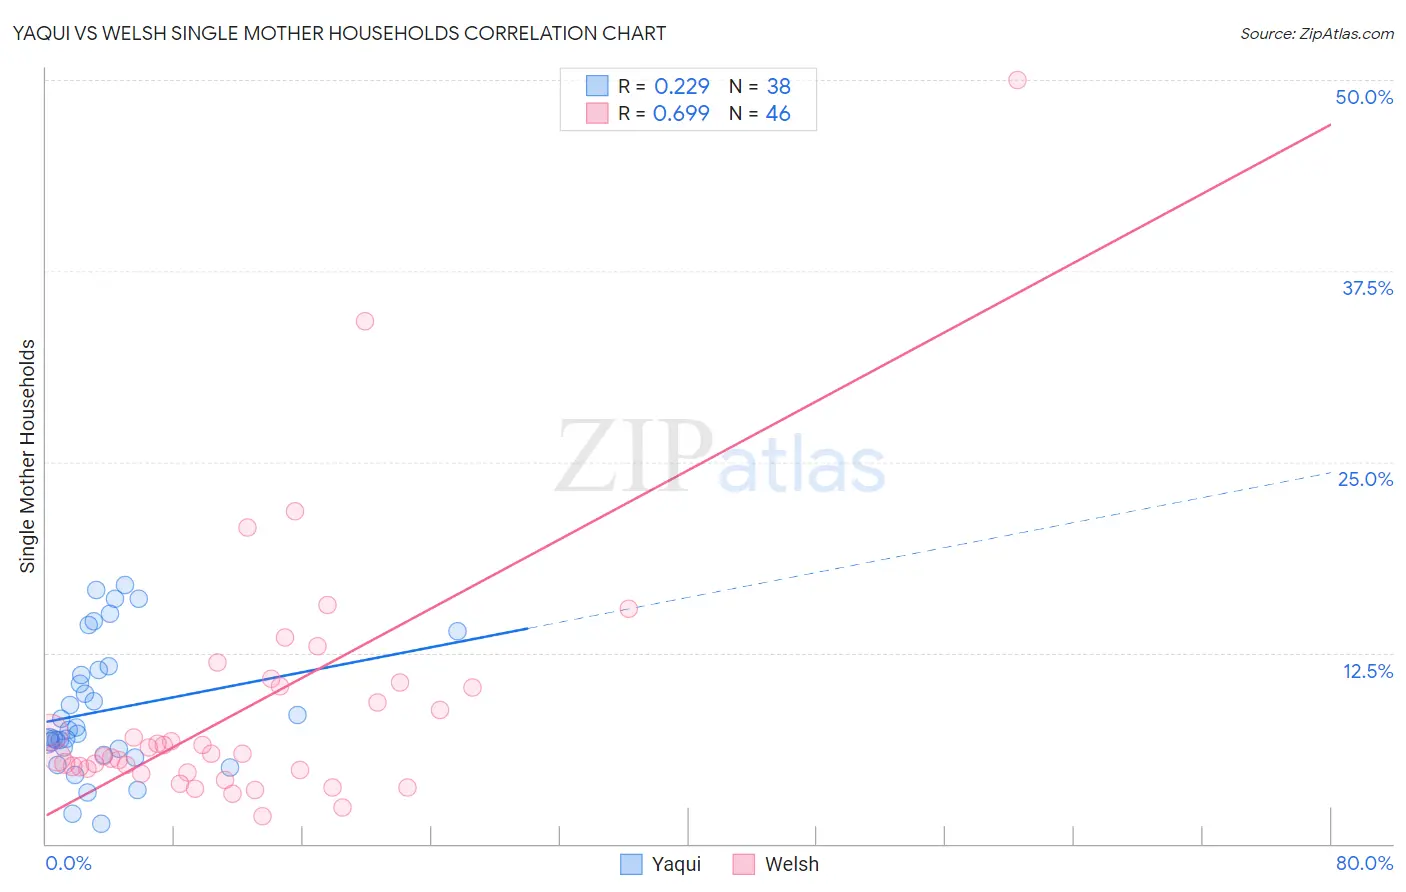
Yaqui vs Welsh Single Mother Households Correlation Chart
The statistical analysis conducted on geographies consisting of 107,663,122 people shows a weak positive correlation between the proportion of Yaqui and percentage of single mother households in the United States with a correlation coefficient (R) of 0.229 and weighted average of 7.4%. Similarly, the statistical analysis conducted on geographies consisting of 524,967,910 people shows a significant positive correlation between the proportion of Welsh and percentage of single mother households in the United States with a correlation coefficient (R) of 0.699 and weighted average of 5.9%, a difference of 26.7%.
Single Mother Households Correlation Summary
| Measurement | Yaqui | Welsh |
| Minimum | 1.3% | 1.8% |
| Maximum | 16.9% | 50.0% |
| Range | 15.6% | 48.2% |
| Mean | 8.7% | 9.0% |
| Median | 7.3% | 5.9% |
| Interquartile 25% (IQ1) | 6.2% | 4.8% |
| Interquartile 75% (IQ3) | 11.4% | 10.3% |
| Interquartile Range (IQR) | 5.2% | 5.5% |
| Standard Deviation (Sample) | 4.2% | 8.6% |
| Standard Deviation (Population) | 4.2% | 8.5% |
Similar Demographics by Single Mother Households
Demographics Similar to Yaqui by Single Mother Households
In terms of single mother households, the demographic groups most similar to Yaqui are Immigrants from Nicaragua (7.4%, a difference of 0.080%), Crow (7.4%, a difference of 0.18%), Immigrants from Somalia (7.4%, a difference of 0.23%), Nepalese (7.5%, a difference of 0.27%), and Japanese (7.4%, a difference of 0.43%).
| Demographics | Rating | Rank | Single Mother Households |
| Alaska Natives | 0.2 /100 | #257 | Tragic 7.4% |
| Pueblo | 0.2 /100 | #258 | Tragic 7.4% |
| Immigrants | Yemen | 0.2 /100 | #259 | Tragic 7.4% |
| Immigrants | Zaire | 0.2 /100 | #260 | Tragic 7.4% |
| Japanese | 0.2 /100 | #261 | Tragic 7.4% |
| Immigrants | Somalia | 0.2 /100 | #262 | Tragic 7.4% |
| Immigrants | Nicaragua | 0.2 /100 | #263 | Tragic 7.4% |
| Yaqui | 0.1 /100 | #264 | Tragic 7.4% |
| Crow | 0.1 /100 | #265 | Tragic 7.4% |
| Nepalese | 0.1 /100 | #266 | Tragic 7.5% |
| Blackfeet | 0.1 /100 | #267 | Tragic 7.5% |
| Indonesians | 0.1 /100 | #268 | Tragic 7.5% |
| Somalis | 0.1 /100 | #269 | Tragic 7.5% |
| Immigrants | Cuba | 0.1 /100 | #270 | Tragic 7.5% |
| Salvadorans | 0.1 /100 | #271 | Tragic 7.5% |
Demographics Similar to Welsh by Single Mother Households
In terms of single mother households, the demographic groups most similar to Welsh are Slavic (5.9%, a difference of 0.020%), Immigrants from Argentina (5.9%, a difference of 0.18%), Lebanese (5.9%, a difference of 0.19%), Immigrants from Uzbekistan (5.9%, a difference of 0.25%), and Czechoslovakian (5.9%, a difference of 0.27%).
| Demographics | Rating | Rank | Single Mother Households |
| South Africans | 94.1 /100 | #119 | Exceptional 5.8% |
| Tongans | 93.7 /100 | #120 | Exceptional 5.8% |
| Argentineans | 93.7 /100 | #121 | Exceptional 5.8% |
| Belgians | 93.5 /100 | #122 | Exceptional 5.8% |
| Immigrants | Uzbekistan | 93.4 /100 | #123 | Exceptional 5.9% |
| Immigrants | Argentina | 93.2 /100 | #124 | Exceptional 5.9% |
| Slavs | 92.9 /100 | #125 | Exceptional 5.9% |
| Welsh | 92.8 /100 | #126 | Exceptional 5.9% |
| Lebanese | 92.4 /100 | #127 | Exceptional 5.9% |
| Czechoslovakians | 92.2 /100 | #128 | Exceptional 5.9% |
| Immigrants | Bolivia | 92.2 /100 | #129 | Exceptional 5.9% |
| Palestinians | 92.1 /100 | #130 | Exceptional 5.9% |
| Immigrants | Spain | 91.2 /100 | #131 | Exceptional 5.9% |
| Albanians | 91.1 /100 | #132 | Exceptional 5.9% |
| Egyptians | 90.7 /100 | #133 | Exceptional 5.9% |