Immigrants from Northern Europe vs Sierra Leonean Single Mother Households
COMPARE
Immigrants from Northern Europe
Sierra Leonean
Single Mother Households
Single Mother Households Comparison
Immigrants from Northern Europe
Sierra Leoneans
5.3%
SINGLE MOTHER HOUSEHOLDS
99.7/ 100
METRIC RATING
35th/ 347
METRIC RANK
7.7%
SINGLE MOTHER HOUSEHOLDS
0.0/ 100
METRIC RATING
288th/ 347
METRIC RANK
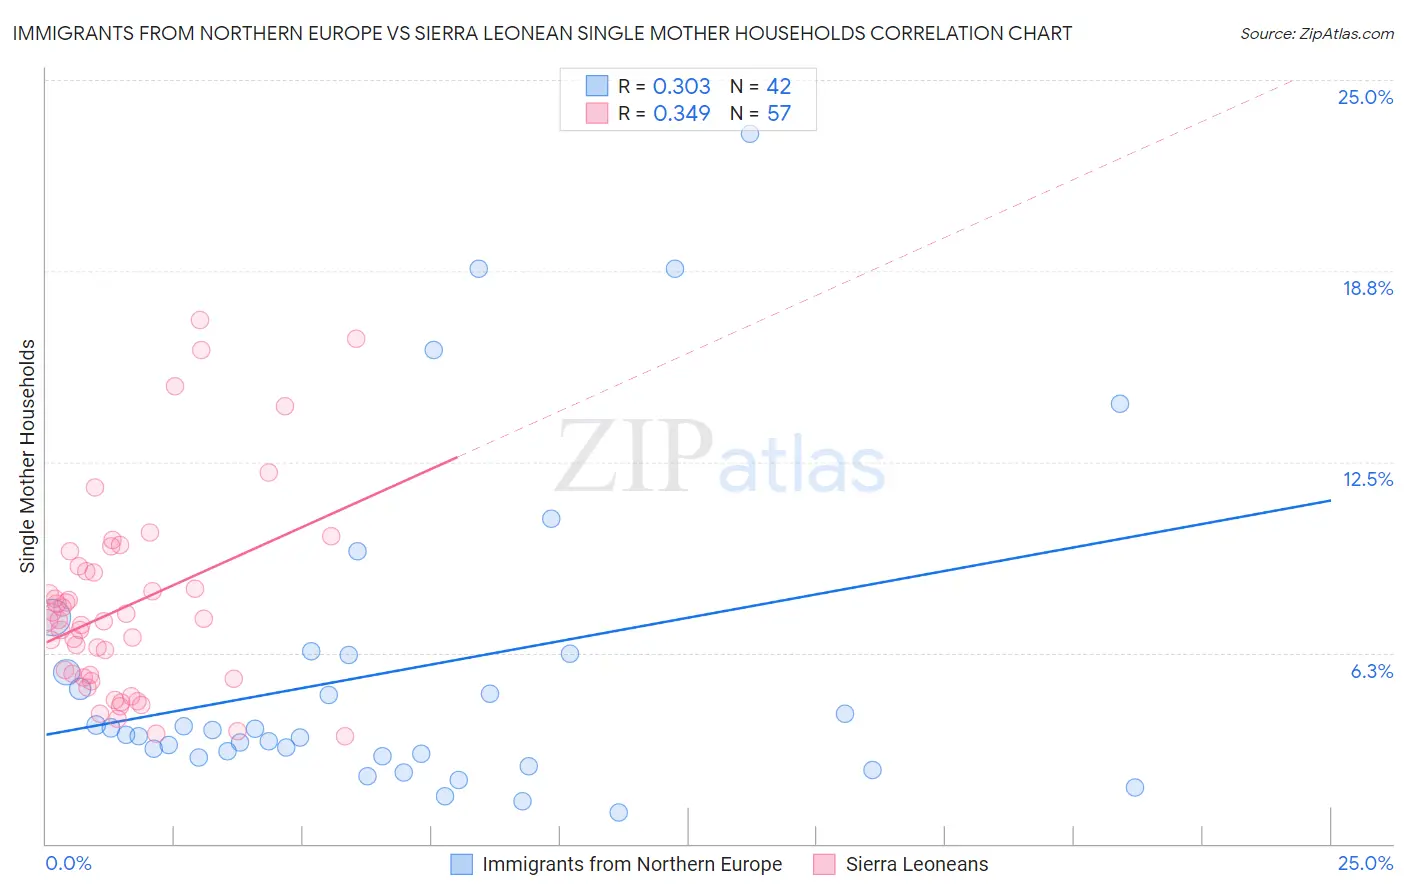
Immigrants from Northern Europe vs Sierra Leonean Single Mother Households Correlation Chart
The statistical analysis conducted on geographies consisting of 474,819,920 people shows a mild positive correlation between the proportion of Immigrants from Northern Europe and percentage of single mother households in the United States with a correlation coefficient (R) of 0.303 and weighted average of 5.3%. Similarly, the statistical analysis conducted on geographies consisting of 83,310,522 people shows a mild positive correlation between the proportion of Sierra Leoneans and percentage of single mother households in the United States with a correlation coefficient (R) of 0.349 and weighted average of 7.7%, a difference of 45.6%.
Single Mother Households Correlation Summary
| Measurement | Immigrants from Northern Europe | Sierra Leonean |
| Minimum | 1.0% | 3.5% |
| Maximum | 23.2% | 17.1% |
| Range | 22.2% | 13.6% |
| Mean | 5.6% | 7.8% |
| Median | 3.6% | 7.3% |
| Interquartile 25% (IQ1) | 2.9% | 5.4% |
| Interquartile 75% (IQ3) | 6.2% | 9.0% |
| Interquartile Range (IQR) | 3.3% | 3.6% |
| Standard Deviation (Sample) | 5.2% | 3.2% |
| Standard Deviation (Population) | 5.1% | 3.2% |
Similar Demographics by Single Mother Households
Demographics Similar to Immigrants from Northern Europe by Single Mother Households
In terms of single mother households, the demographic groups most similar to Immigrants from Northern Europe are Bulgarian (5.3%, a difference of 0.040%), Immigrants from Switzerland (5.3%, a difference of 0.060%), Immigrants from Czechoslovakia (5.3%, a difference of 0.20%), Immigrants from Belgium (5.3%, a difference of 0.35%), and Cambodian (5.3%, a difference of 0.44%).
| Demographics | Rating | Rank | Single Mother Households |
| Russians | 99.7 /100 | #28 | Exceptional 5.3% |
| Latvians | 99.7 /100 | #29 | Exceptional 5.3% |
| Burmese | 99.7 /100 | #30 | Exceptional 5.3% |
| Immigrants | Korea | 99.7 /100 | #31 | Exceptional 5.3% |
| Cambodians | 99.7 /100 | #32 | Exceptional 5.3% |
| Immigrants | Switzerland | 99.7 /100 | #33 | Exceptional 5.3% |
| Bulgarians | 99.7 /100 | #34 | Exceptional 5.3% |
| Immigrants | Northern Europe | 99.7 /100 | #35 | Exceptional 5.3% |
| Immigrants | Czechoslovakia | 99.7 /100 | #36 | Exceptional 5.3% |
| Immigrants | Belgium | 99.7 /100 | #37 | Exceptional 5.3% |
| Immigrants | Serbia | 99.6 /100 | #38 | Exceptional 5.4% |
| Immigrants | Sweden | 99.6 /100 | #39 | Exceptional 5.4% |
| Estonians | 99.6 /100 | #40 | Exceptional 5.4% |
| Immigrants | Greece | 99.5 /100 | #41 | Exceptional 5.4% |
| Macedonians | 99.5 /100 | #42 | Exceptional 5.4% |
Demographics Similar to Sierra Leoneans by Single Mother Households
In terms of single mother households, the demographic groups most similar to Sierra Leoneans are Immigrants from Guatemala (7.7%, a difference of 0.050%), Immigrants from Middle Africa (7.7%, a difference of 0.15%), Trinidadian and Tobagonian (7.7%, a difference of 0.26%), Immigrants from Belize (7.7%, a difference of 0.29%), and Nigerian (7.7%, a difference of 0.89%).
| Demographics | Rating | Rank | Single Mother Households |
| Immigrants | Laos | 0.0 /100 | #281 | Tragic 7.7% |
| Guatemalans | 0.0 /100 | #282 | Tragic 7.7% |
| Nigerians | 0.0 /100 | #283 | Tragic 7.7% |
| Immigrants | Belize | 0.0 /100 | #284 | Tragic 7.7% |
| Trinidadians and Tobagonians | 0.0 /100 | #285 | Tragic 7.7% |
| Immigrants | Middle Africa | 0.0 /100 | #286 | Tragic 7.7% |
| Immigrants | Guatemala | 0.0 /100 | #287 | Tragic 7.7% |
| Sierra Leoneans | 0.0 /100 | #288 | Tragic 7.7% |
| Sub-Saharan Africans | 0.0 /100 | #289 | Tragic 7.8% |
| Immigrants | Nigeria | 0.0 /100 | #290 | Tragic 7.8% |
| West Indians | 0.0 /100 | #291 | Tragic 7.8% |
| Ghanaians | 0.0 /100 | #292 | Tragic 7.8% |
| Immigrants | Cameroon | 0.0 /100 | #293 | Tragic 7.9% |
| Apache | 0.0 /100 | #294 | Tragic 7.9% |
| Barbadians | 0.0 /100 | #295 | Tragic 7.9% |