Cheyenne vs Immigrants from Hong Kong Seniors Poverty Over the Age of 75
COMPARE
Cheyenne
Immigrants from Hong Kong
Seniors Poverty Over the Age of 75
Seniors Poverty Over the Age of 75 Comparison
Cheyenne
Immigrants from Hong Kong
14.9%
SENIORS POVERTY OVER THE AGE OF 75
0.0/ 100
METRIC RATING
284th/ 347
METRIC RANK
12.8%
SENIORS POVERTY OVER THE AGE OF 75
6.5/ 100
METRIC RATING
212th/ 347
METRIC RANK
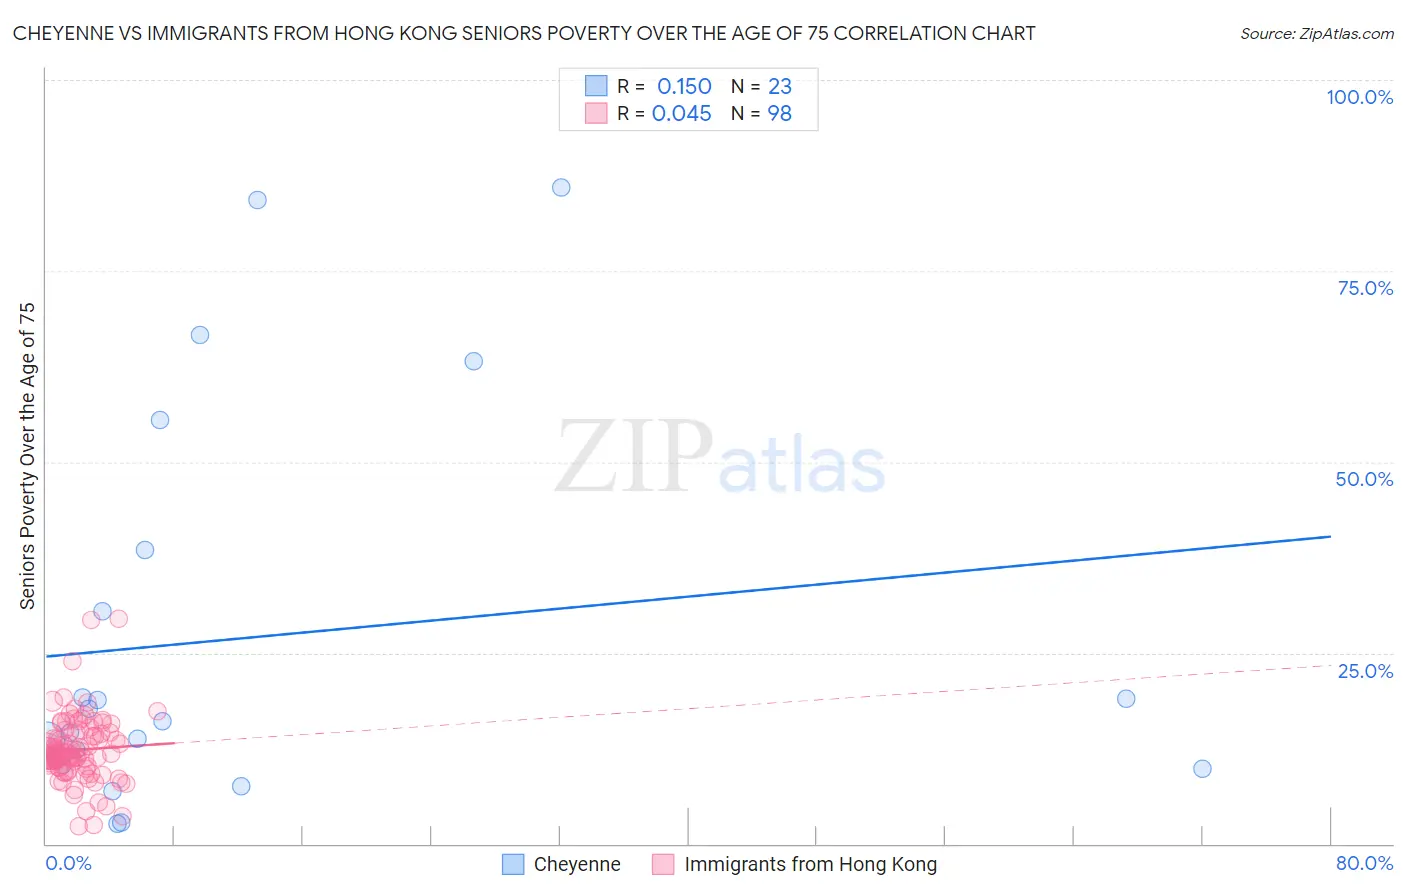
Cheyenne vs Immigrants from Hong Kong Seniors Poverty Over the Age of 75 Correlation Chart
The statistical analysis conducted on geographies consisting of 80,378,238 people shows a poor positive correlation between the proportion of Cheyenne and poverty level among seniors over the age of 75 in the United States with a correlation coefficient (R) of 0.150 and weighted average of 14.9%. Similarly, the statistical analysis conducted on geographies consisting of 252,162,249 people shows no correlation between the proportion of Immigrants from Hong Kong and poverty level among seniors over the age of 75 in the United States with a correlation coefficient (R) of 0.045 and weighted average of 12.8%, a difference of 15.9%.
Seniors Poverty Over the Age of 75 Correlation Summary
| Measurement | Cheyenne | Immigrants from Hong Kong |
| Minimum | 2.7% | 2.3% |
| Maximum | 85.9% | 29.4% |
| Range | 83.2% | 27.1% |
| Mean | 27.0% | 12.3% |
| Median | 16.1% | 11.8% |
| Interquartile 25% (IQ1) | 10.3% | 10.1% |
| Interquartile 75% (IQ3) | 38.5% | 14.5% |
| Interquartile Range (IQR) | 28.2% | 4.4% |
| Standard Deviation (Sample) | 25.7% | 4.4% |
| Standard Deviation (Population) | 25.1% | 4.4% |
Similar Demographics by Seniors Poverty Over the Age of 75
Demographics Similar to Cheyenne by Seniors Poverty Over the Age of 75
In terms of seniors poverty over the age of 75, the demographic groups most similar to Cheyenne are Immigrants from Mexico (14.9%, a difference of 0.19%), Immigrants from Central America (15.0%, a difference of 0.53%), Guatemalan (14.8%, a difference of 0.64%), Immigrants from Senegal (14.8%, a difference of 0.70%), and Belizean (14.8%, a difference of 0.88%).
| Demographics | Rating | Rank | Seniors Poverty Over the Age of 75 |
| Senegalese | 0.0 /100 | #277 | Tragic 14.5% |
| Immigrants | Colombia | 0.0 /100 | #278 | Tragic 14.6% |
| Blacks/African Americans | 0.0 /100 | #279 | Tragic 14.6% |
| Central Americans | 0.0 /100 | #280 | Tragic 14.7% |
| Belizeans | 0.0 /100 | #281 | Tragic 14.8% |
| Immigrants | Senegal | 0.0 /100 | #282 | Tragic 14.8% |
| Guatemalans | 0.0 /100 | #283 | Tragic 14.8% |
| Cheyenne | 0.0 /100 | #284 | Tragic 14.9% |
| Immigrants | Mexico | 0.0 /100 | #285 | Tragic 14.9% |
| Immigrants | Central America | 0.0 /100 | #286 | Tragic 15.0% |
| Immigrants | Guatemala | 0.0 /100 | #287 | Tragic 15.1% |
| Jamaicans | 0.0 /100 | #288 | Tragic 15.1% |
| Immigrants | Belize | 0.0 /100 | #289 | Tragic 15.2% |
| Immigrants | Azores | 0.0 /100 | #290 | Tragic 15.2% |
| Paiute | 0.0 /100 | #291 | Tragic 15.2% |
Demographics Similar to Immigrants from Hong Kong by Seniors Poverty Over the Age of 75
In terms of seniors poverty over the age of 75, the demographic groups most similar to Immigrants from Hong Kong are Brazilian (12.8%, a difference of 0.13%), Comanche (12.8%, a difference of 0.15%), French American Indian (12.9%, a difference of 0.15%), Immigrants from Africa (12.9%, a difference of 0.22%), and Immigrants from Liberia (12.8%, a difference of 0.25%).
| Demographics | Rating | Rank | Seniors Poverty Over the Age of 75 |
| Indians (Asian) | 9.7 /100 | #205 | Tragic 12.7% |
| Albanians | 9.6 /100 | #206 | Tragic 12.7% |
| Costa Ricans | 8.7 /100 | #207 | Tragic 12.8% |
| Immigrants | Eastern Asia | 8.4 /100 | #208 | Tragic 12.8% |
| Immigrants | Liberia | 7.3 /100 | #209 | Tragic 12.8% |
| Comanche | 7.0 /100 | #210 | Tragic 12.8% |
| Brazilians | 6.9 /100 | #211 | Tragic 12.8% |
| Immigrants | Hong Kong | 6.5 /100 | #212 | Tragic 12.8% |
| French American Indians | 6.1 /100 | #213 | Tragic 12.9% |
| Immigrants | Africa | 5.9 /100 | #214 | Tragic 12.9% |
| South American Indians | 5.5 /100 | #215 | Tragic 12.9% |
| Immigrants | Brazil | 5.2 /100 | #216 | Tragic 12.9% |
| Bermudans | 4.9 /100 | #217 | Tragic 12.9% |
| Immigrants | Western Asia | 4.9 /100 | #218 | Tragic 12.9% |
| Ute | 4.7 /100 | #219 | Tragic 12.9% |