Cherokee vs Korean Single Mother Households
COMPARE
Cherokee
Korean
Single Mother Households
Single Mother Households Comparison
Cherokee
Koreans
6.8%
SINGLE MOTHER HOUSEHOLDS
5.1/ 100
METRIC RATING
216th/ 347
METRIC RANK
6.0%
SINGLE MOTHER HOUSEHOLDS
84.4/ 100
METRIC RATING
144th/ 347
METRIC RANK
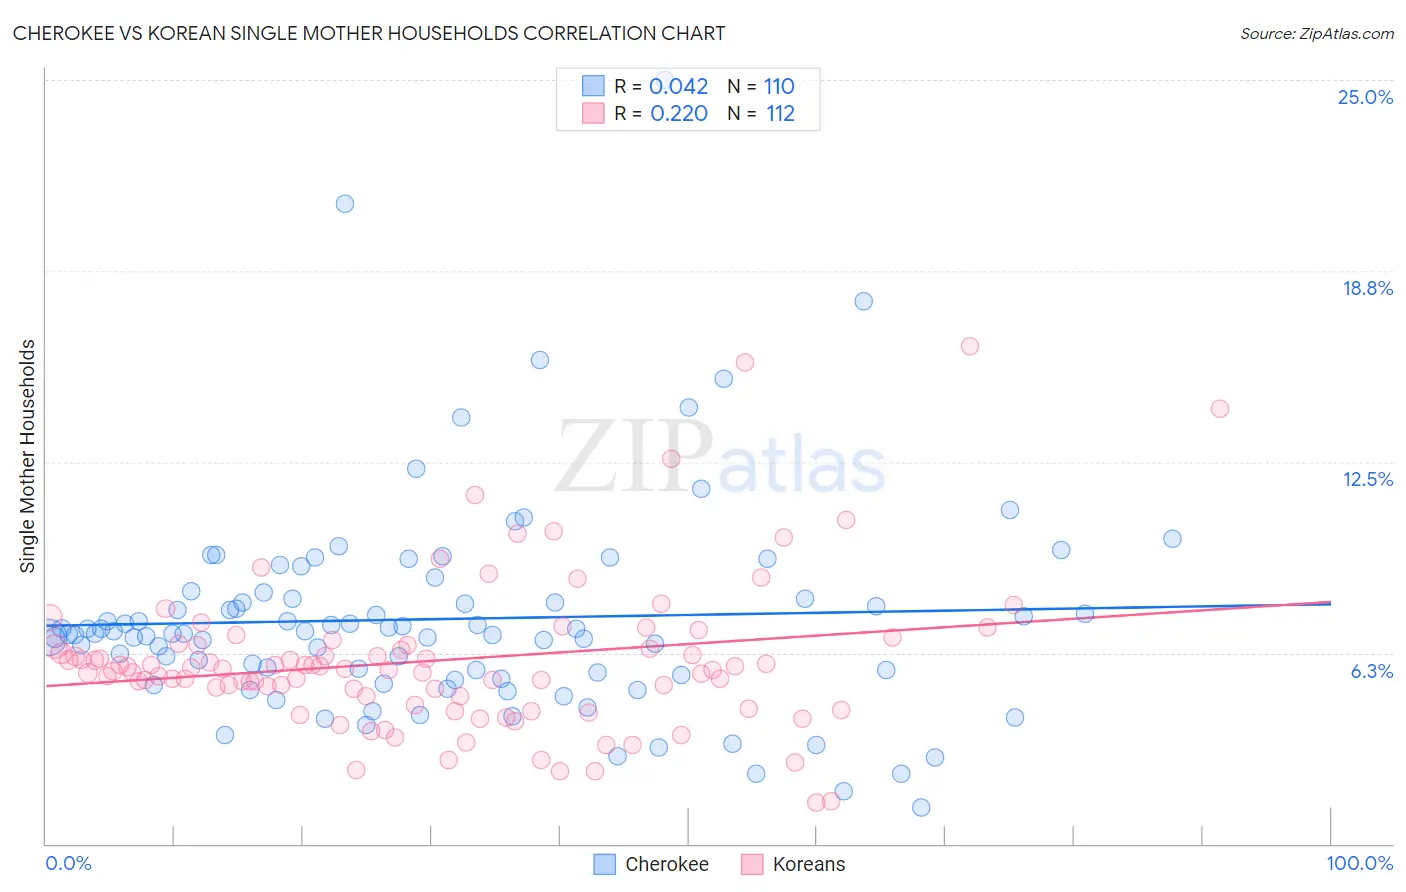
Cherokee vs Korean Single Mother Households Correlation Chart
The statistical analysis conducted on geographies consisting of 491,457,452 people shows no correlation between the proportion of Cherokee and percentage of single mother households in the United States with a correlation coefficient (R) of 0.042 and weighted average of 6.8%. Similarly, the statistical analysis conducted on geographies consisting of 508,458,058 people shows a weak positive correlation between the proportion of Koreans and percentage of single mother households in the United States with a correlation coefficient (R) of 0.220 and weighted average of 6.0%, a difference of 13.2%.
Single Mother Households Correlation Summary
| Measurement | Cherokee | Korean |
| Minimum | 1.2% | 1.4% |
| Maximum | 25.0% | 16.3% |
| Range | 23.8% | 14.9% |
| Mean | 7.4% | 6.0% |
| Median | 6.9% | 5.7% |
| Interquartile 25% (IQ1) | 5.5% | 4.8% |
| Interquartile 75% (IQ3) | 8.0% | 6.5% |
| Interquartile Range (IQR) | 2.5% | 1.7% |
| Standard Deviation (Sample) | 3.5% | 2.5% |
| Standard Deviation (Population) | 3.5% | 2.5% |
Similar Demographics by Single Mother Households
Demographics Similar to Cherokee by Single Mother Households
In terms of single mother households, the demographic groups most similar to Cherokee are Aleut (6.8%, a difference of 0.14%), Shoshone (6.8%, a difference of 0.29%), Immigrants from Eastern Africa (6.8%, a difference of 0.36%), Immigrants (6.8%, a difference of 0.44%), and Immigrants from Thailand (6.9%, a difference of 0.63%).
| Demographics | Rating | Rank | Single Mother Households |
| Immigrants | Colombia | 10.5 /100 | #209 | Poor 6.7% |
| Immigrants | Nonimmigrants | 10.4 /100 | #210 | Poor 6.7% |
| Immigrants | Venezuela | 8.5 /100 | #211 | Tragic 6.7% |
| Immigrants | Eritrea | 8.4 /100 | #212 | Tragic 6.7% |
| Immigrants | Costa Rica | 8.2 /100 | #213 | Tragic 6.7% |
| Immigrants | Uruguay | 7.9 /100 | #214 | Tragic 6.7% |
| Shoshone | 5.7 /100 | #215 | Tragic 6.8% |
| Cherokee | 5.1 /100 | #216 | Tragic 6.8% |
| Aleuts | 4.8 /100 | #217 | Tragic 6.8% |
| Immigrants | Eastern Africa | 4.4 /100 | #218 | Tragic 6.8% |
| Immigrants | Immigrants | 4.3 /100 | #219 | Tragic 6.8% |
| Immigrants | Thailand | 4.0 /100 | #220 | Tragic 6.9% |
| French American Indians | 3.7 /100 | #221 | Tragic 6.9% |
| Immigrants | Bangladesh | 3.7 /100 | #222 | Tragic 6.9% |
| Immigrants | Micronesia | 3.6 /100 | #223 | Tragic 6.9% |
Demographics Similar to Koreans by Single Mother Households
In terms of single mother households, the demographic groups most similar to Koreans are Arab (6.0%, a difference of 0.090%), Immigrants from Iraq (6.0%, a difference of 0.10%), Immigrants from Egypt (6.0%, a difference of 0.14%), Tsimshian (6.0%, a difference of 0.19%), and French (6.0%, a difference of 0.29%).
| Demographics | Rating | Rank | Single Mother Households |
| Immigrants | Pakistan | 88.4 /100 | #137 | Excellent 6.0% |
| Icelanders | 86.9 /100 | #138 | Excellent 6.0% |
| Syrians | 86.0 /100 | #139 | Excellent 6.0% |
| French | 85.7 /100 | #140 | Excellent 6.0% |
| Tsimshian | 85.2 /100 | #141 | Excellent 6.0% |
| Immigrants | Egypt | 85.0 /100 | #142 | Excellent 6.0% |
| Immigrants | Iraq | 84.8 /100 | #143 | Excellent 6.0% |
| Koreans | 84.4 /100 | #144 | Excellent 6.0% |
| Arabs | 84.0 /100 | #145 | Excellent 6.0% |
| French Canadians | 82.6 /100 | #146 | Excellent 6.0% |
| Immigrants | Jordan | 82.3 /100 | #147 | Excellent 6.0% |
| Scotch-Irish | 82.0 /100 | #148 | Excellent 6.0% |
| Immigrants | Albania | 81.5 /100 | #149 | Excellent 6.1% |
| Zimbabweans | 80.7 /100 | #150 | Excellent 6.1% |
| Immigrants | Southern Europe | 80.5 /100 | #151 | Excellent 6.1% |