Central American vs Mexican American Indian Family Households with Children
COMPARE
Central American
Mexican American Indian
Family Households with Children
Family Households with Children Comparison
Central Americans
Mexican American Indians
29.1%
FAMILY HOUSEHOLDS WITH CHILDREN
100.0/ 100
METRIC RATING
40th/ 347
METRIC RANK
29.7%
FAMILY HOUSEHOLDS WITH CHILDREN
100.0/ 100
METRIC RATING
23rd/ 347
METRIC RANK
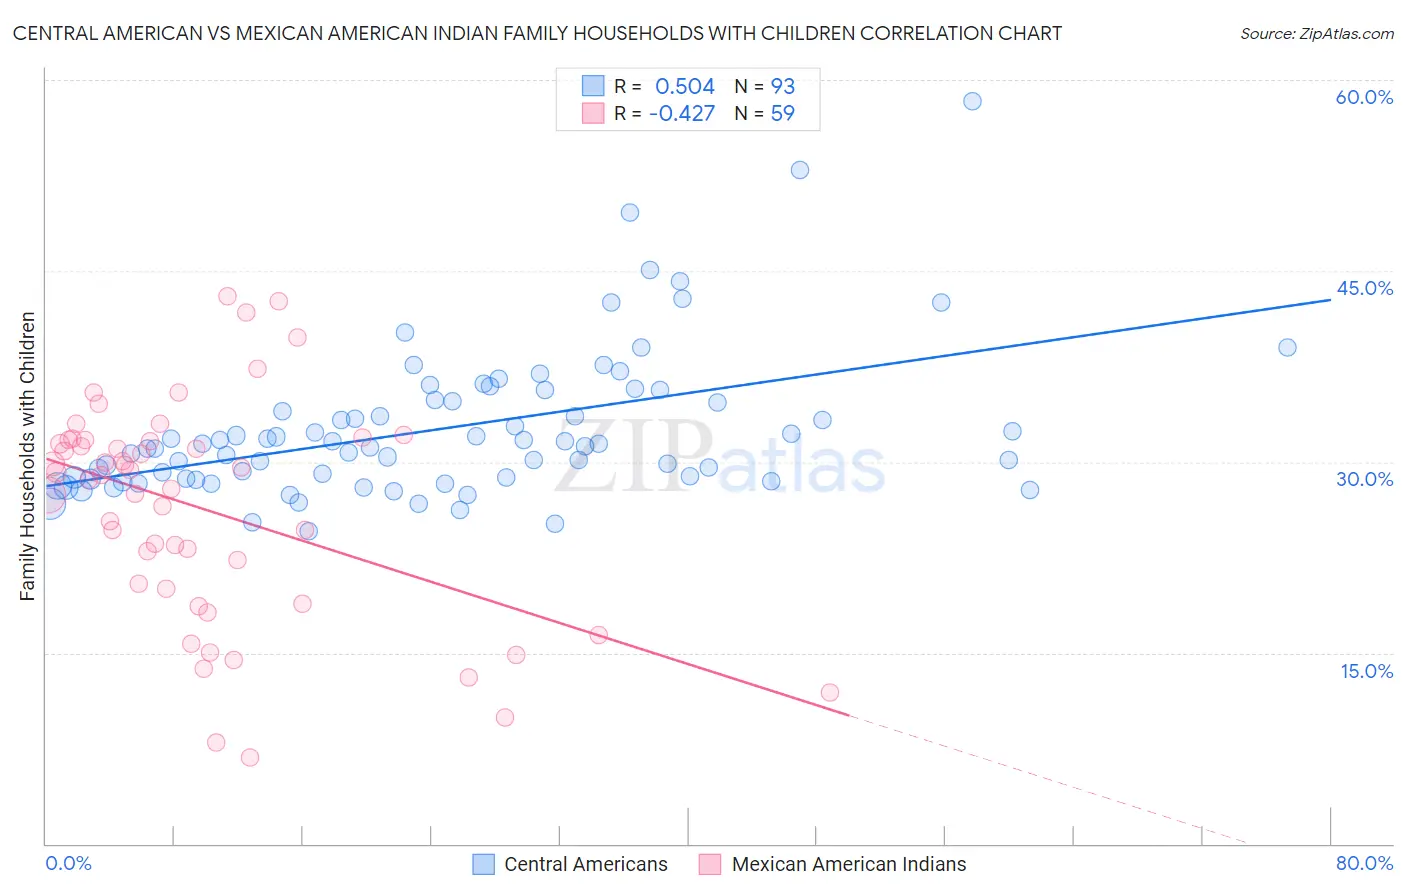
Central American vs Mexican American Indian Family Households with Children Correlation Chart
The statistical analysis conducted on geographies consisting of 503,865,600 people shows a substantial positive correlation between the proportion of Central Americans and percentage of family households with children in the United States with a correlation coefficient (R) of 0.504 and weighted average of 29.1%. Similarly, the statistical analysis conducted on geographies consisting of 317,453,959 people shows a moderate negative correlation between the proportion of Mexican American Indians and percentage of family households with children in the United States with a correlation coefficient (R) of -0.427 and weighted average of 29.7%, a difference of 2.1%.
Family Households with Children Correlation Summary
| Measurement | Central American | Mexican American Indian |
| Minimum | 24.5% | 6.8% |
| Maximum | 58.3% | 43.0% |
| Range | 33.8% | 36.2% |
| Mean | 32.6% | 26.3% |
| Median | 31.2% | 29.0% |
| Interquartile 25% (IQ1) | 28.7% | 20.1% |
| Interquartile 75% (IQ3) | 34.8% | 31.7% |
| Interquartile Range (IQR) | 6.1% | 11.7% |
| Standard Deviation (Sample) | 5.8% | 8.6% |
| Standard Deviation (Population) | 5.8% | 8.5% |
Demographics Similar to Central Americans and Mexican American Indians by Family Households with Children
In terms of family households with children, the demographic groups most similar to Central Americans are Yaqui (29.1%, a difference of 0.010%), Immigrants from South Eastern Asia (29.1%, a difference of 0.090%), Korean (29.2%, a difference of 0.16%), Immigrants from Cameroon (29.2%, a difference of 0.30%), and Immigrants from Venezuela (29.3%, a difference of 0.57%). Similarly, the demographic groups most similar to Mexican American Indians are Guamanian/Chamorro (29.7%, a difference of 0.10%), Immigrants from Latin America (29.7%, a difference of 0.20%), Malaysian (29.8%, a difference of 0.27%), Immigrants from Laos (29.8%, a difference of 0.31%), and Sri Lankan (29.5%, a difference of 0.64%).
| Demographics | Rating | Rank | Family Households with Children |
| Immigrants | Laos | 100.0 /100 | #21 | Exceptional 29.8% |
| Malaysians | 100.0 /100 | #22 | Exceptional 29.8% |
| Mexican American Indians | 100.0 /100 | #23 | Exceptional 29.7% |
| Guamanians/Chamorros | 100.0 /100 | #24 | Exceptional 29.7% |
| Immigrants | Latin America | 100.0 /100 | #25 | Exceptional 29.7% |
| Sri Lankans | 100.0 /100 | #26 | Exceptional 29.5% |
| Immigrants | Vietnam | 100.0 /100 | #27 | Exceptional 29.5% |
| Samoans | 100.0 /100 | #28 | Exceptional 29.5% |
| Bolivians | 100.0 /100 | #29 | Exceptional 29.5% |
| Yuman | 100.0 /100 | #30 | Exceptional 29.5% |
| Japanese | 100.0 /100 | #31 | Exceptional 29.4% |
| Immigrants | Yemen | 100.0 /100 | #32 | Exceptional 29.4% |
| Venezuelans | 100.0 /100 | #33 | Exceptional 29.4% |
| Immigrants | Bolivia | 100.0 /100 | #34 | Exceptional 29.3% |
| Immigrants | Sierra Leone | 100.0 /100 | #35 | Exceptional 29.3% |
| Immigrants | Venezuela | 100.0 /100 | #36 | Exceptional 29.3% |
| Immigrants | Cameroon | 100.0 /100 | #37 | Exceptional 29.2% |
| Koreans | 100.0 /100 | #38 | Exceptional 29.2% |
| Yaqui | 100.0 /100 | #39 | Exceptional 29.1% |
| Central Americans | 100.0 /100 | #40 | Exceptional 29.1% |
| Immigrants | South Eastern Asia | 100.0 /100 | #41 | Exceptional 29.1% |