Central American vs Albanian Family Households with Children
COMPARE
Central American
Albanian
Family Households with Children
Family Households with Children Comparison
Central Americans
Albanians
29.1%
FAMILY HOUSEHOLDS WITH CHILDREN
100.0/ 100
METRIC RATING
40th/ 347
METRIC RANK
26.5%
FAMILY HOUSEHOLDS WITH CHILDREN
0.2/ 100
METRIC RATING
290th/ 347
METRIC RANK
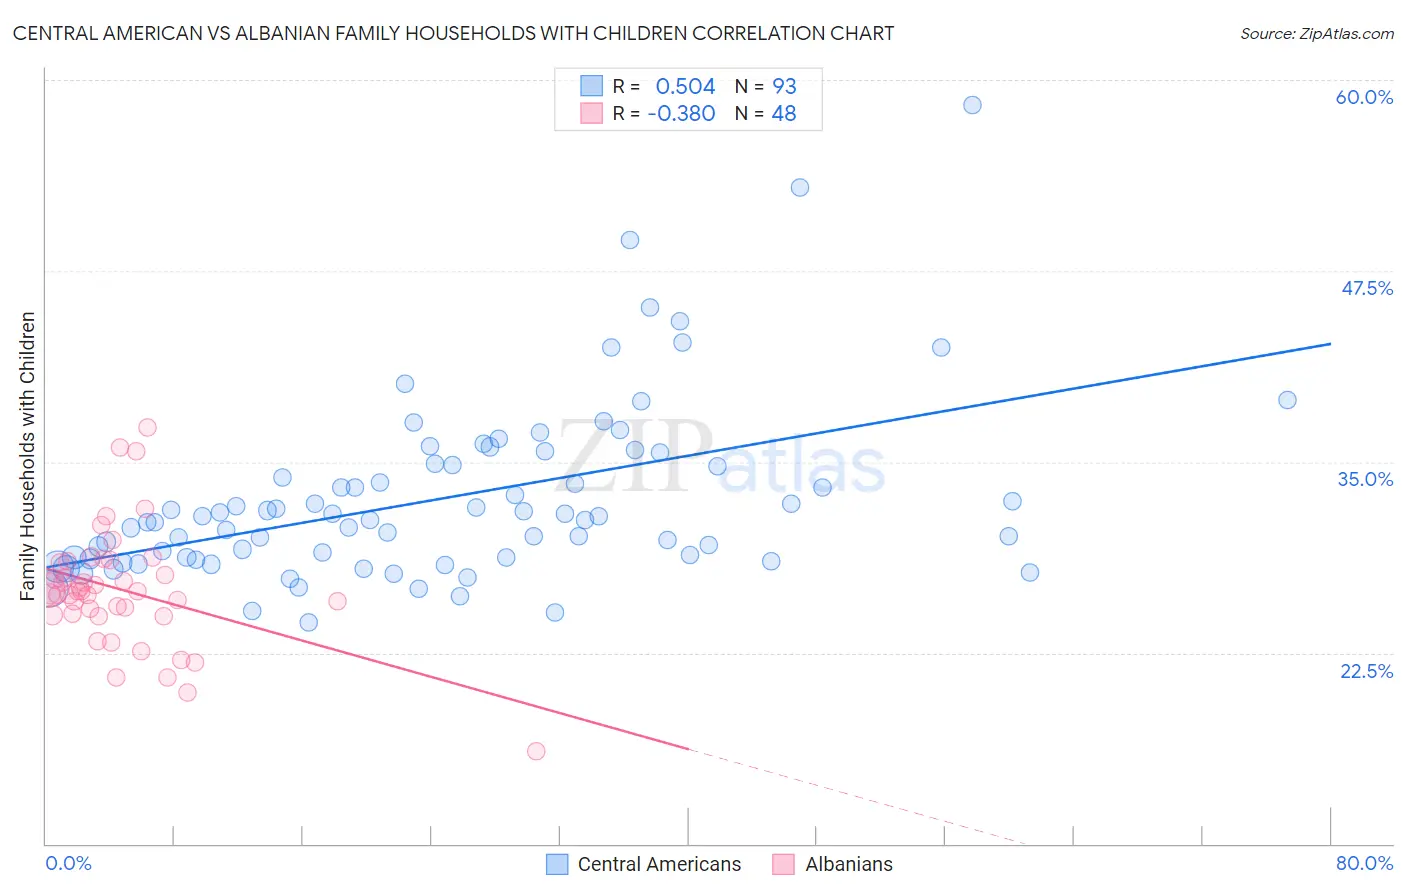
Central American vs Albanian Family Households with Children Correlation Chart
The statistical analysis conducted on geographies consisting of 503,865,600 people shows a substantial positive correlation between the proportion of Central Americans and percentage of family households with children in the United States with a correlation coefficient (R) of 0.504 and weighted average of 29.1%. Similarly, the statistical analysis conducted on geographies consisting of 193,166,642 people shows a mild negative correlation between the proportion of Albanians and percentage of family households with children in the United States with a correlation coefficient (R) of -0.380 and weighted average of 26.5%, a difference of 10.0%.
Family Households with Children Correlation Summary
| Measurement | Central American | Albanian |
| Minimum | 24.5% | 16.1% |
| Maximum | 58.3% | 37.3% |
| Range | 33.8% | 21.2% |
| Mean | 32.6% | 26.6% |
| Median | 31.2% | 26.5% |
| Interquartile 25% (IQ1) | 28.7% | 25.0% |
| Interquartile 75% (IQ3) | 34.8% | 28.4% |
| Interquartile Range (IQR) | 6.1% | 3.4% |
| Standard Deviation (Sample) | 5.8% | 3.9% |
| Standard Deviation (Population) | 5.8% | 3.8% |
Similar Demographics by Family Households with Children
Demographics Similar to Central Americans by Family Households with Children
In terms of family households with children, the demographic groups most similar to Central Americans are Yaqui (29.1%, a difference of 0.010%), Immigrants from South Eastern Asia (29.1%, a difference of 0.090%), Spanish American Indian (29.1%, a difference of 0.090%), Korean (29.2%, a difference of 0.16%), and Asian (29.1%, a difference of 0.28%).
| Demographics | Rating | Rank | Family Households with Children |
| Venezuelans | 100.0 /100 | #33 | Exceptional 29.4% |
| Immigrants | Bolivia | 100.0 /100 | #34 | Exceptional 29.3% |
| Immigrants | Sierra Leone | 100.0 /100 | #35 | Exceptional 29.3% |
| Immigrants | Venezuela | 100.0 /100 | #36 | Exceptional 29.3% |
| Immigrants | Cameroon | 100.0 /100 | #37 | Exceptional 29.2% |
| Koreans | 100.0 /100 | #38 | Exceptional 29.2% |
| Yaqui | 100.0 /100 | #39 | Exceptional 29.1% |
| Central Americans | 100.0 /100 | #40 | Exceptional 29.1% |
| Immigrants | South Eastern Asia | 100.0 /100 | #41 | Exceptional 29.1% |
| Spanish American Indians | 100.0 /100 | #42 | Exceptional 29.1% |
| Asians | 100.0 /100 | #43 | Exceptional 29.1% |
| Immigrants | Taiwan | 100.0 /100 | #44 | Exceptional 29.0% |
| Fijians | 100.0 /100 | #45 | Exceptional 29.0% |
| Immigrants | Philippines | 100.0 /100 | #46 | Exceptional 29.0% |
| Peruvians | 100.0 /100 | #47 | Exceptional 29.0% |
Demographics Similar to Albanians by Family Households with Children
In terms of family households with children, the demographic groups most similar to Albanians are Bahamian (26.5%, a difference of 0.010%), Polish (26.5%, a difference of 0.010%), Black/African American (26.5%, a difference of 0.060%), Immigrants from Sweden (26.5%, a difference of 0.11%), and Latvian (26.4%, a difference of 0.12%).
| Demographics | Rating | Rank | Family Households with Children |
| Immigrants | North America | 0.3 /100 | #283 | Tragic 26.6% |
| Immigrants | Canada | 0.3 /100 | #284 | Tragic 26.5% |
| Cambodians | 0.2 /100 | #285 | Tragic 26.5% |
| Immigrants | Senegal | 0.2 /100 | #286 | Tragic 26.5% |
| Shoshone | 0.2 /100 | #287 | Tragic 26.5% |
| Russians | 0.2 /100 | #288 | Tragic 26.5% |
| Immigrants | Sweden | 0.2 /100 | #289 | Tragic 26.5% |
| Albanians | 0.2 /100 | #290 | Tragic 26.5% |
| Bahamians | 0.2 /100 | #291 | Tragic 26.5% |
| Poles | 0.2 /100 | #292 | Tragic 26.5% |
| Blacks/African Americans | 0.1 /100 | #293 | Tragic 26.5% |
| Latvians | 0.1 /100 | #294 | Tragic 26.4% |
| Macedonians | 0.1 /100 | #295 | Tragic 26.4% |
| Croatians | 0.1 /100 | #296 | Tragic 26.4% |
| Armenians | 0.1 /100 | #297 | Tragic 26.4% |