Liberian vs Mexican American Indian Family Households with Children
COMPARE
Liberian
Mexican American Indian
Family Households with Children
Family Households with Children Comparison
Liberians
Mexican American Indians
28.3%
FAMILY HOUSEHOLDS WITH CHILDREN
99.6/ 100
METRIC RATING
88th/ 347
METRIC RANK
29.7%
FAMILY HOUSEHOLDS WITH CHILDREN
100.0/ 100
METRIC RATING
23rd/ 347
METRIC RANK
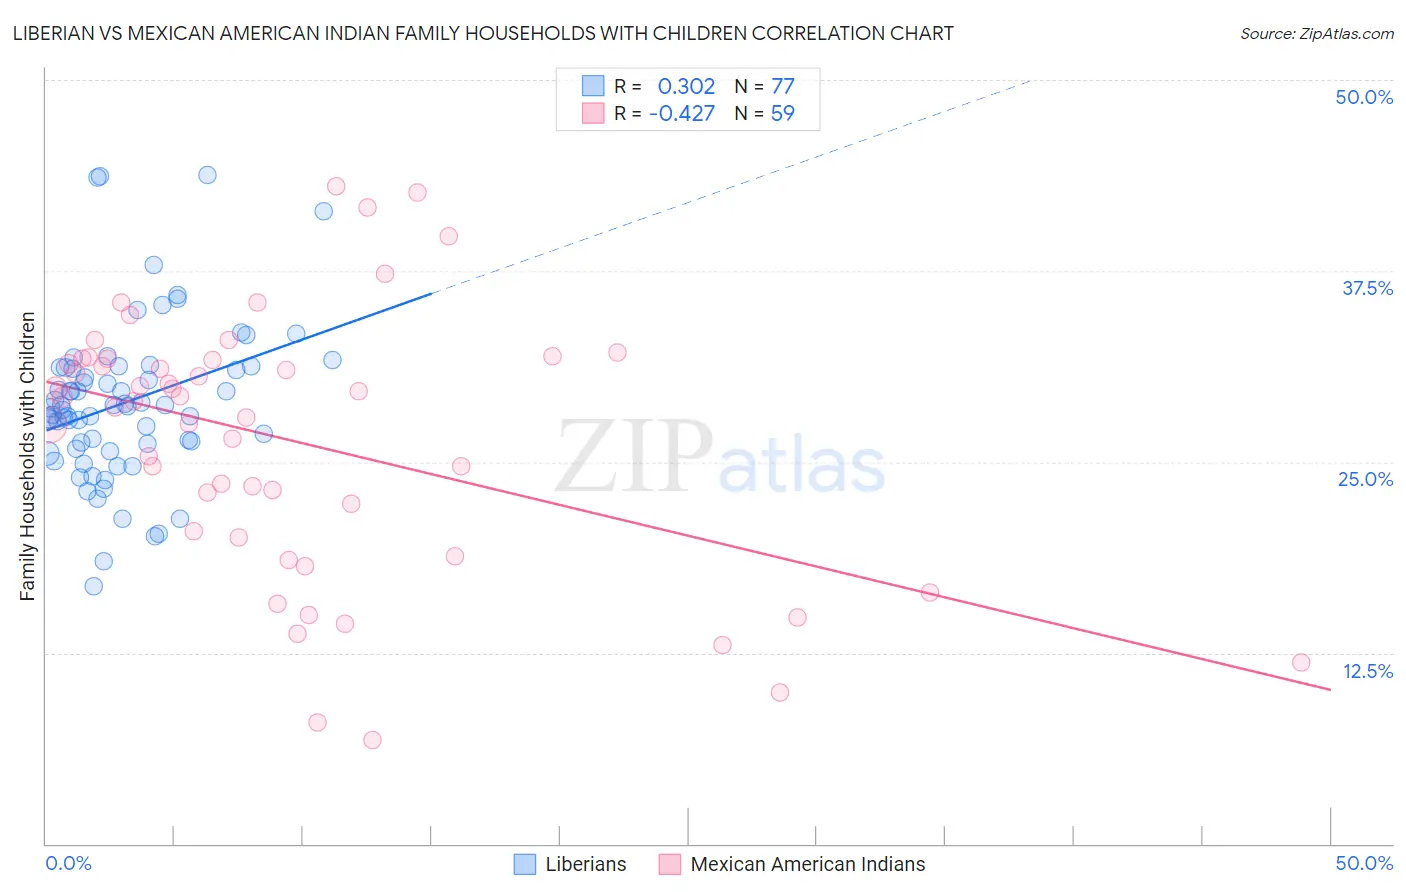
Liberian vs Mexican American Indian Family Households with Children Correlation Chart
The statistical analysis conducted on geographies consisting of 118,011,319 people shows a mild positive correlation between the proportion of Liberians and percentage of family households with children in the United States with a correlation coefficient (R) of 0.302 and weighted average of 28.3%. Similarly, the statistical analysis conducted on geographies consisting of 317,453,959 people shows a moderate negative correlation between the proportion of Mexican American Indians and percentage of family households with children in the United States with a correlation coefficient (R) of -0.427 and weighted average of 29.7%, a difference of 5.2%.
Family Households with Children Correlation Summary
| Measurement | Liberian | Mexican American Indian |
| Minimum | 16.9% | 6.8% |
| Maximum | 43.8% | 43.0% |
| Range | 27.0% | 36.2% |
| Mean | 28.9% | 26.3% |
| Median | 28.7% | 29.0% |
| Interquartile 25% (IQ1) | 26.0% | 20.1% |
| Interquartile 75% (IQ3) | 31.2% | 31.7% |
| Interquartile Range (IQR) | 5.1% | 11.7% |
| Standard Deviation (Sample) | 5.2% | 8.6% |
| Standard Deviation (Population) | 5.2% | 8.5% |
Similar Demographics by Family Households with Children
Demographics Similar to Liberians by Family Households with Children
In terms of family households with children, the demographic groups most similar to Liberians are Colombian (28.3%, a difference of 0.010%), Immigrants from Costa Rica (28.3%, a difference of 0.010%), Immigrants from Western Africa (28.3%, a difference of 0.070%), Immigrants from Thailand (28.2%, a difference of 0.11%), and Immigrants from Liberia (28.2%, a difference of 0.16%).
| Demographics | Rating | Rank | Family Households with Children |
| South Americans | 99.8 /100 | #81 | Exceptional 28.4% |
| Kenyans | 99.8 /100 | #82 | Exceptional 28.4% |
| Nicaraguans | 99.8 /100 | #83 | Exceptional 28.4% |
| Costa Ricans | 99.8 /100 | #84 | Exceptional 28.4% |
| Immigrants | Syria | 99.8 /100 | #85 | Exceptional 28.4% |
| Immigrants | Western Africa | 99.6 /100 | #86 | Exceptional 28.3% |
| Colombians | 99.6 /100 | #87 | Exceptional 28.3% |
| Liberians | 99.6 /100 | #88 | Exceptional 28.3% |
| Immigrants | Costa Rica | 99.6 /100 | #89 | Exceptional 28.3% |
| Immigrants | Thailand | 99.5 /100 | #90 | Exceptional 28.2% |
| Immigrants | Liberia | 99.4 /100 | #91 | Exceptional 28.2% |
| Chickasaw | 99.4 /100 | #92 | Exceptional 28.2% |
| Panamanians | 99.3 /100 | #93 | Exceptional 28.2% |
| Immigrants | Colombia | 99.2 /100 | #94 | Exceptional 28.2% |
| Immigrants | Nicaragua | 99.1 /100 | #95 | Exceptional 28.2% |
Demographics Similar to Mexican American Indians by Family Households with Children
In terms of family households with children, the demographic groups most similar to Mexican American Indians are Guamanian/Chamorro (29.7%, a difference of 0.10%), Immigrants from Latin America (29.7%, a difference of 0.20%), Malaysian (29.8%, a difference of 0.27%), Immigrants from Laos (29.8%, a difference of 0.31%), and Immigrants from El Salvador (29.8%, a difference of 0.35%).
| Demographics | Rating | Rank | Family Households with Children |
| Immigrants | Afghanistan | 100.0 /100 | #16 | Exceptional 30.0% |
| Hispanics or Latinos | 100.0 /100 | #17 | Exceptional 29.9% |
| Salvadorans | 100.0 /100 | #18 | Exceptional 29.9% |
| Alaska Natives | 100.0 /100 | #19 | Exceptional 29.9% |
| Immigrants | El Salvador | 100.0 /100 | #20 | Exceptional 29.8% |
| Immigrants | Laos | 100.0 /100 | #21 | Exceptional 29.8% |
| Malaysians | 100.0 /100 | #22 | Exceptional 29.8% |
| Mexican American Indians | 100.0 /100 | #23 | Exceptional 29.7% |
| Guamanians/Chamorros | 100.0 /100 | #24 | Exceptional 29.7% |
| Immigrants | Latin America | 100.0 /100 | #25 | Exceptional 29.7% |
| Sri Lankans | 100.0 /100 | #26 | Exceptional 29.5% |
| Immigrants | Vietnam | 100.0 /100 | #27 | Exceptional 29.5% |
| Samoans | 100.0 /100 | #28 | Exceptional 29.5% |
| Bolivians | 100.0 /100 | #29 | Exceptional 29.5% |
| Yuman | 100.0 /100 | #30 | Exceptional 29.5% |