Central American vs Immigrants from Kuwait Family Households with Children
COMPARE
Central American
Immigrants from Kuwait
Family Households with Children
Family Households with Children Comparison
Central Americans
Immigrants from Kuwait
29.1%
FAMILY HOUSEHOLDS WITH CHILDREN
100.0/ 100
METRIC RATING
40th/ 347
METRIC RANK
27.5%
FAMILY HOUSEHOLDS WITH CHILDREN
60.9/ 100
METRIC RATING
168th/ 347
METRIC RANK
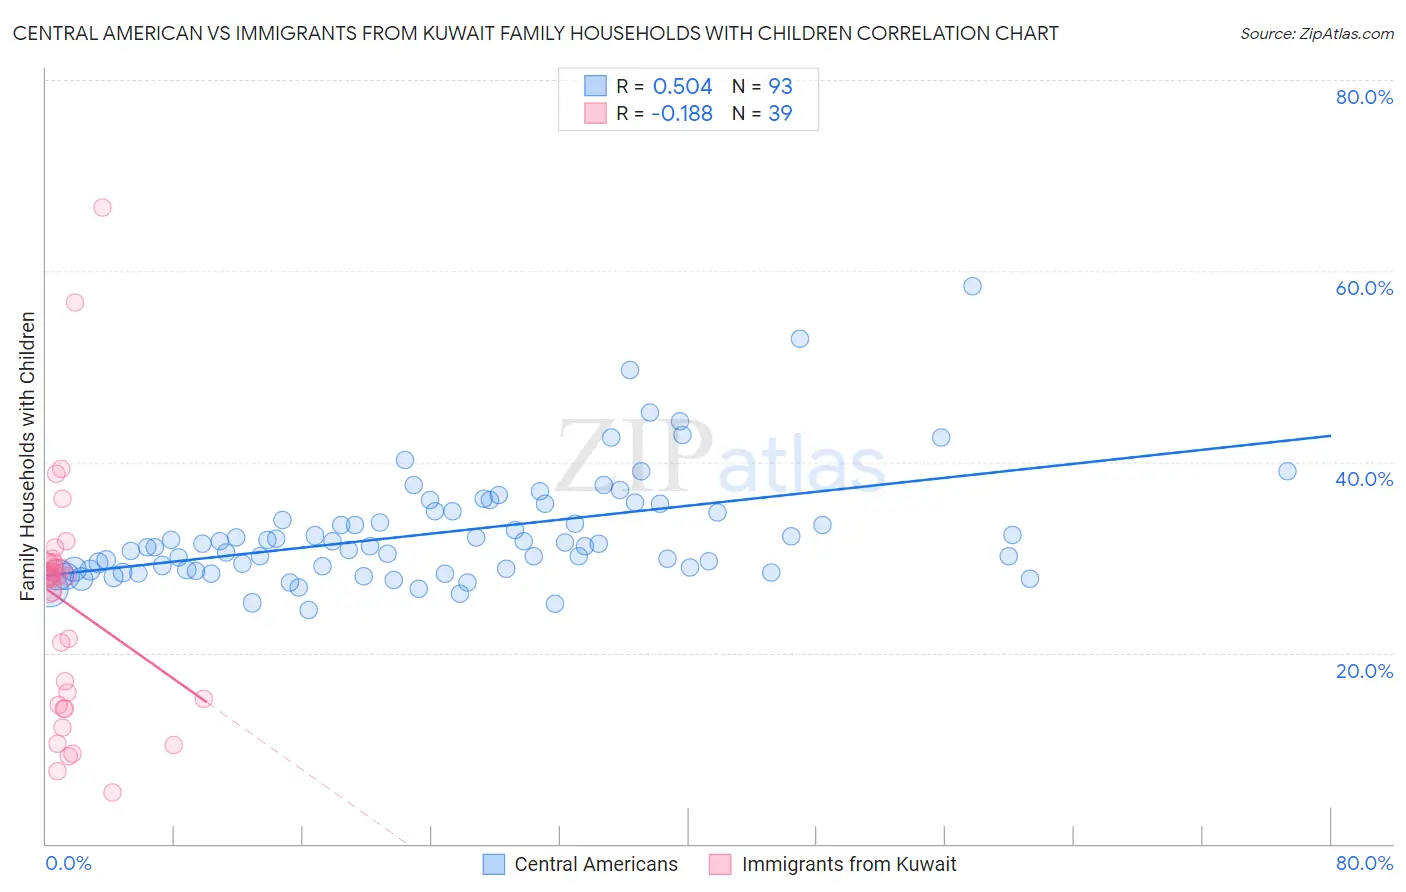
Central American vs Immigrants from Kuwait Family Households with Children Correlation Chart
The statistical analysis conducted on geographies consisting of 503,865,600 people shows a substantial positive correlation between the proportion of Central Americans and percentage of family households with children in the United States with a correlation coefficient (R) of 0.504 and weighted average of 29.1%. Similarly, the statistical analysis conducted on geographies consisting of 136,880,094 people shows a poor negative correlation between the proportion of Immigrants from Kuwait and percentage of family households with children in the United States with a correlation coefficient (R) of -0.188 and weighted average of 27.5%, a difference of 5.9%.
Family Households with Children Correlation Summary
| Measurement | Central American | Immigrants from Kuwait |
| Minimum | 24.5% | 5.3% |
| Maximum | 58.3% | 66.6% |
| Range | 33.8% | 61.3% |
| Mean | 32.6% | 25.1% |
| Median | 31.2% | 28.0% |
| Interquartile 25% (IQ1) | 28.7% | 14.5% |
| Interquartile 75% (IQ3) | 34.8% | 29.4% |
| Interquartile Range (IQR) | 6.1% | 14.9% |
| Standard Deviation (Sample) | 5.8% | 12.5% |
| Standard Deviation (Population) | 5.8% | 12.3% |
Similar Demographics by Family Households with Children
Demographics Similar to Central Americans by Family Households with Children
In terms of family households with children, the demographic groups most similar to Central Americans are Yaqui (29.1%, a difference of 0.010%), Immigrants from South Eastern Asia (29.1%, a difference of 0.090%), Spanish American Indian (29.1%, a difference of 0.090%), Korean (29.2%, a difference of 0.16%), and Asian (29.1%, a difference of 0.28%).
| Demographics | Rating | Rank | Family Households with Children |
| Venezuelans | 100.0 /100 | #33 | Exceptional 29.4% |
| Immigrants | Bolivia | 100.0 /100 | #34 | Exceptional 29.3% |
| Immigrants | Sierra Leone | 100.0 /100 | #35 | Exceptional 29.3% |
| Immigrants | Venezuela | 100.0 /100 | #36 | Exceptional 29.3% |
| Immigrants | Cameroon | 100.0 /100 | #37 | Exceptional 29.2% |
| Koreans | 100.0 /100 | #38 | Exceptional 29.2% |
| Yaqui | 100.0 /100 | #39 | Exceptional 29.1% |
| Central Americans | 100.0 /100 | #40 | Exceptional 29.1% |
| Immigrants | South Eastern Asia | 100.0 /100 | #41 | Exceptional 29.1% |
| Spanish American Indians | 100.0 /100 | #42 | Exceptional 29.1% |
| Asians | 100.0 /100 | #43 | Exceptional 29.1% |
| Immigrants | Taiwan | 100.0 /100 | #44 | Exceptional 29.0% |
| Fijians | 100.0 /100 | #45 | Exceptional 29.0% |
| Immigrants | Philippines | 100.0 /100 | #46 | Exceptional 29.0% |
| Peruvians | 100.0 /100 | #47 | Exceptional 29.0% |
Demographics Similar to Immigrants from Kuwait by Family Households with Children
In terms of family households with children, the demographic groups most similar to Immigrants from Kuwait are Immigrants from South Africa (27.5%, a difference of 0.010%), Nonimmigrants (27.5%, a difference of 0.010%), Dominican (27.5%, a difference of 0.010%), Immigrants from Hong Kong (27.5%, a difference of 0.090%), and Seminole (27.5%, a difference of 0.090%).
| Demographics | Rating | Rank | Family Households with Children |
| Alaskan Athabascans | 67.1 /100 | #161 | Good 27.6% |
| Immigrants | Bangladesh | 67.0 /100 | #162 | Good 27.6% |
| Czechs | 65.3 /100 | #163 | Good 27.5% |
| Immigrants | Hong Kong | 64.9 /100 | #164 | Good 27.5% |
| Immigrants | South Africa | 61.3 /100 | #165 | Good 27.5% |
| Immigrants | Nonimmigrants | 61.2 /100 | #166 | Good 27.5% |
| Dominicans | 61.1 /100 | #167 | Good 27.5% |
| Immigrants | Kuwait | 60.9 /100 | #168 | Good 27.5% |
| Seminole | 56.9 /100 | #169 | Average 27.5% |
| Cherokee | 56.7 /100 | #170 | Average 27.5% |
| Blackfeet | 54.3 /100 | #171 | Average 27.5% |
| Israelis | 53.9 /100 | #172 | Average 27.5% |
| Immigrants | Argentina | 52.2 /100 | #173 | Average 27.5% |
| Whites/Caucasians | 50.0 /100 | #174 | Average 27.4% |
| British | 49.9 /100 | #175 | Average 27.4% |