Central American vs Cherokee Single Father Households
COMPARE
Central American
Cherokee
Single Father Households
Single Father Households Comparison
Central Americans
Cherokee
2.9%
SINGLE FATHER HOUSEHOLDS
0.0/ 100
METRIC RATING
309th/ 347
METRIC RANK
2.6%
SINGLE FATHER HOUSEHOLDS
0.1/ 100
METRIC RATING
278th/ 347
METRIC RANK
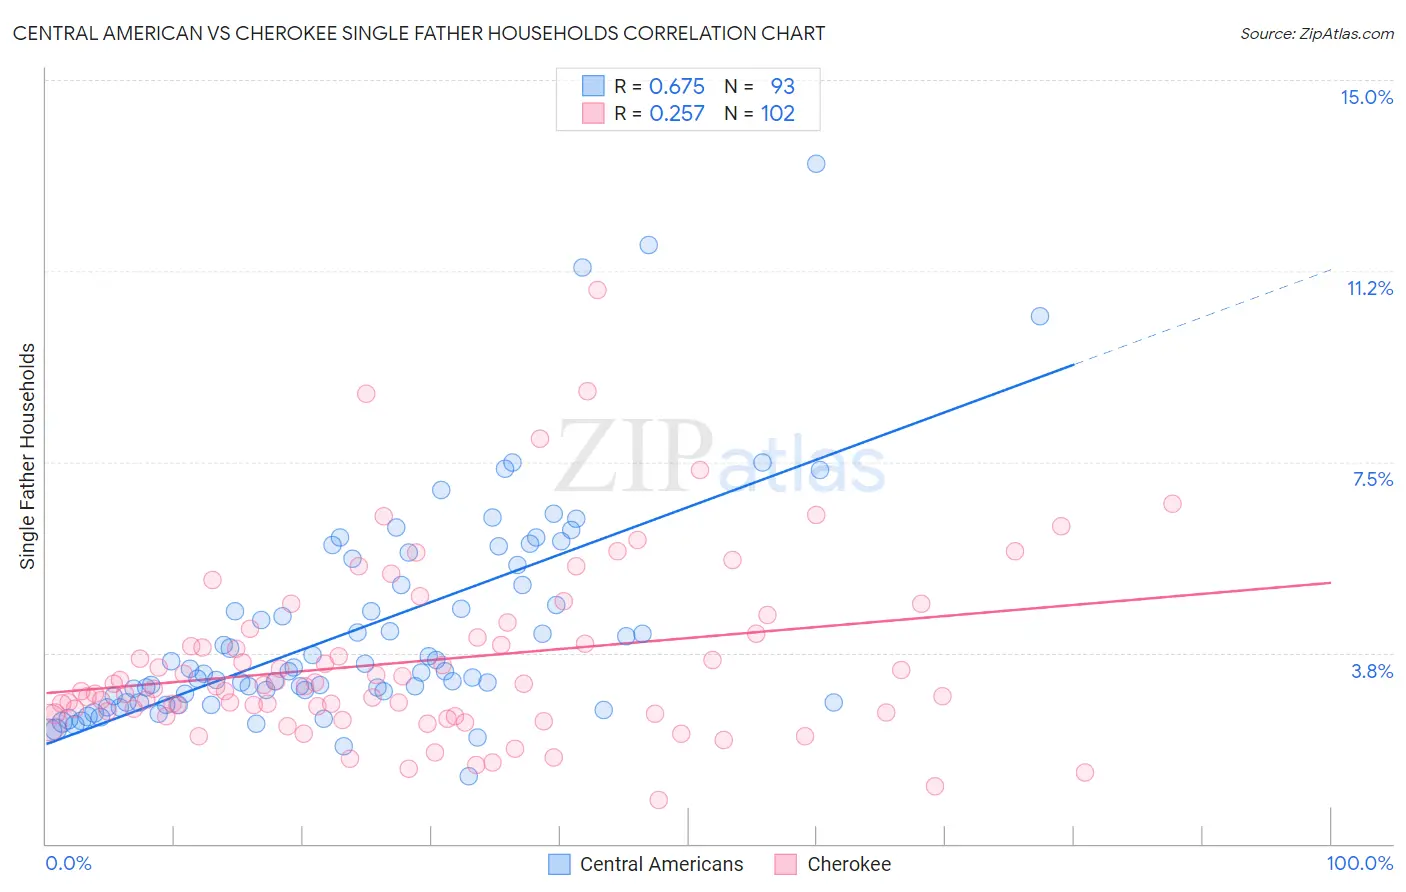
Central American vs Cherokee Single Father Households Correlation Chart
The statistical analysis conducted on geographies consisting of 497,759,507 people shows a significant positive correlation between the proportion of Central Americans and percentage of single father households in the United States with a correlation coefficient (R) of 0.675 and weighted average of 2.9%. Similarly, the statistical analysis conducted on geographies consisting of 486,508,076 people shows a weak positive correlation between the proportion of Cherokee and percentage of single father households in the United States with a correlation coefficient (R) of 0.257 and weighted average of 2.6%, a difference of 8.8%.
Single Father Households Correlation Summary
| Measurement | Central American | Cherokee |
| Minimum | 1.3% | 0.86% |
| Maximum | 13.4% | 10.9% |
| Range | 12.0% | 10.0% |
| Mean | 4.2% | 3.6% |
| Median | 3.4% | 3.1% |
| Interquartile 25% (IQ1) | 2.8% | 2.6% |
| Interquartile 75% (IQ3) | 5.3% | 4.1% |
| Interquartile Range (IQR) | 2.5% | 1.6% |
| Standard Deviation (Sample) | 2.2% | 1.7% |
| Standard Deviation (Population) | 2.2% | 1.7% |
Similar Demographics by Single Father Households
Demographics Similar to Central Americans by Single Father Households
In terms of single father households, the demographic groups most similar to Central Americans are Immigrants from Laos (2.9%, a difference of 0.21%), Spanish American Indian (2.9%, a difference of 0.69%), Apache (2.8%, a difference of 0.71%), Hopi (2.8%, a difference of 0.89%), and Immigrants from the Azores (2.8%, a difference of 1.1%).
| Demographics | Rating | Rank | Single Father Households |
| Spanish Americans | 0.0 /100 | #302 | Tragic 2.8% |
| Immigrants | Honduras | 0.0 /100 | #303 | Tragic 2.8% |
| Mexican American Indians | 0.0 /100 | #304 | Tragic 2.8% |
| Hispanics or Latinos | 0.0 /100 | #305 | Tragic 2.8% |
| Immigrants | Azores | 0.0 /100 | #306 | Tragic 2.8% |
| Hopi | 0.0 /100 | #307 | Tragic 2.8% |
| Apache | 0.0 /100 | #308 | Tragic 2.8% |
| Central Americans | 0.0 /100 | #309 | Tragic 2.9% |
| Immigrants | Laos | 0.0 /100 | #310 | Tragic 2.9% |
| Spanish American Indians | 0.0 /100 | #311 | Tragic 2.9% |
| Tsimshian | 0.0 /100 | #312 | Tragic 2.9% |
| Arapaho | 0.0 /100 | #313 | Tragic 2.9% |
| Salvadorans | 0.0 /100 | #314 | Tragic 2.9% |
| Cheyenne | 0.0 /100 | #315 | Tragic 2.9% |
| Houma | 0.0 /100 | #316 | Tragic 2.9% |
Demographics Similar to Cherokee by Single Father Households
In terms of single father households, the demographic groups most similar to Cherokee are Samoan (2.6%, a difference of 0.040%), Shoshone (2.6%, a difference of 0.050%), Immigrants from Haiti (2.6%, a difference of 0.080%), Immigrants from Dominican Republic (2.6%, a difference of 0.29%), and Immigrants from Portugal (2.6%, a difference of 0.59%).
| Demographics | Rating | Rank | Single Father Households |
| Creek | 0.2 /100 | #271 | Tragic 2.6% |
| Belizeans | 0.2 /100 | #272 | Tragic 2.6% |
| Iroquois | 0.2 /100 | #273 | Tragic 2.6% |
| Puerto Ricans | 0.2 /100 | #274 | Tragic 2.6% |
| Immigrants | Dominican Republic | 0.2 /100 | #275 | Tragic 2.6% |
| Immigrants | Haiti | 0.1 /100 | #276 | Tragic 2.6% |
| Shoshone | 0.1 /100 | #277 | Tragic 2.6% |
| Cherokee | 0.1 /100 | #278 | Tragic 2.6% |
| Samoans | 0.1 /100 | #279 | Tragic 2.6% |
| Immigrants | Portugal | 0.1 /100 | #280 | Tragic 2.6% |
| Nicaraguans | 0.1 /100 | #281 | Tragic 2.6% |
| Dutch West Indians | 0.1 /100 | #282 | Tragic 2.6% |
| Immigrants | Nicaragua | 0.1 /100 | #283 | Tragic 2.7% |
| Hawaiians | 0.1 /100 | #284 | Tragic 2.7% |
| Ottawa | 0.1 /100 | #285 | Tragic 2.7% |