Central American vs Immigrants from Cabo Verde Unemployment Among Ages 20 to 24 years
COMPARE
Central American
Immigrants from Cabo Verde
Unemployment Among Ages 20 to 24 years
Unemployment Among Ages 20 to 24 years Comparison
Central Americans
Immigrants from Cabo Verde
10.6%
UNEMPLOYMENT AMONG AGES 20 TO 24 YEARS
6.8/ 100
METRIC RATING
221st/ 347
METRIC RANK
12.2%
UNEMPLOYMENT AMONG AGES 20 TO 24 YEARS
0.0/ 100
METRIC RATING
302nd/ 347
METRIC RANK
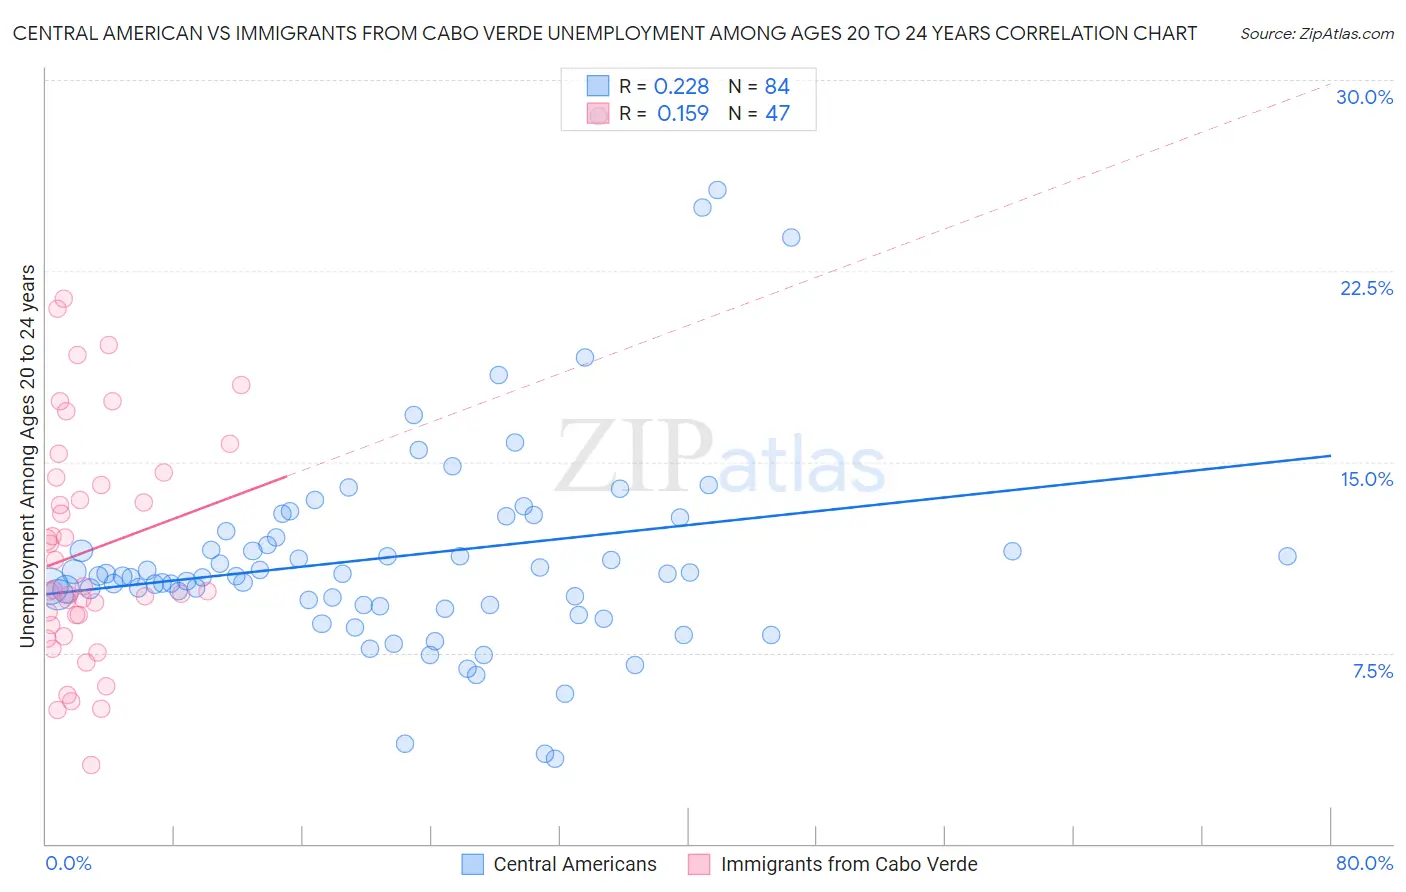
Central American vs Immigrants from Cabo Verde Unemployment Among Ages 20 to 24 years Correlation Chart
The statistical analysis conducted on geographies consisting of 480,623,393 people shows a weak positive correlation between the proportion of Central Americans and unemployment rate among population between the ages 20 and 24 in the United States with a correlation coefficient (R) of 0.228 and weighted average of 10.6%. Similarly, the statistical analysis conducted on geographies consisting of 37,888,752 people shows a poor positive correlation between the proportion of Immigrants from Cabo Verde and unemployment rate among population between the ages 20 and 24 in the United States with a correlation coefficient (R) of 0.159 and weighted average of 12.2%, a difference of 15.8%.
Unemployment Among Ages 20 to 24 years Correlation Summary
| Measurement | Central American | Immigrants from Cabo Verde |
| Minimum | 3.3% | 3.1% |
| Maximum | 28.6% | 21.4% |
| Range | 25.3% | 18.3% |
| Mean | 11.3% | 11.5% |
| Median | 10.5% | 10.0% |
| Interquartile 25% (IQ1) | 9.4% | 8.6% |
| Interquartile 75% (IQ3) | 12.1% | 14.4% |
| Interquartile Range (IQR) | 2.8% | 5.8% |
| Standard Deviation (Sample) | 4.3% | 4.4% |
| Standard Deviation (Population) | 4.2% | 4.4% |
Similar Demographics by Unemployment Among Ages 20 to 24 years
Demographics Similar to Central Americans by Unemployment Among Ages 20 to 24 years
In terms of unemployment among ages 20 to 24 years, the demographic groups most similar to Central Americans are Eastern European (10.6%, a difference of 0.010%), Immigrants from Poland (10.6%, a difference of 0.060%), Immigrants from Southern Europe (10.5%, a difference of 0.15%), Arab (10.6%, a difference of 0.18%), and Nonimmigrants (10.5%, a difference of 0.25%).
| Demographics | Rating | Rank | Unemployment Among Ages 20 to 24 years |
| Kiowa | 11.7 /100 | #214 | Poor 10.5% |
| Hondurans | 10.5 /100 | #215 | Poor 10.5% |
| Costa Ricans | 9.6 /100 | #216 | Tragic 10.5% |
| Cherokee | 9.3 /100 | #217 | Tragic 10.5% |
| Immigrants | Nonimmigrants | 8.8 /100 | #218 | Tragic 10.5% |
| Immigrants | Southern Europe | 8.0 /100 | #219 | Tragic 10.5% |
| Eastern Europeans | 6.9 /100 | #220 | Tragic 10.6% |
| Central Americans | 6.8 /100 | #221 | Tragic 10.6% |
| Immigrants | Poland | 6.4 /100 | #222 | Tragic 10.6% |
| Arabs | 5.6 /100 | #223 | Tragic 10.6% |
| Nepalese | 5.1 /100 | #224 | Tragic 10.6% |
| Immigrants | South America | 5.1 /100 | #225 | Tragic 10.6% |
| Immigrants | Costa Rica | 4.9 /100 | #226 | Tragic 10.6% |
| Palestinians | 4.9 /100 | #227 | Tragic 10.6% |
| Mexican American Indians | 4.6 /100 | #228 | Tragic 10.6% |
Demographics Similar to Immigrants from Cabo Verde by Unemployment Among Ages 20 to 24 years
In terms of unemployment among ages 20 to 24 years, the demographic groups most similar to Immigrants from Cabo Verde are Haitian (12.2%, a difference of 0.020%), Immigrants from West Indies (12.3%, a difference of 0.61%), Chippewa (12.3%, a difference of 0.65%), Immigrants from Sierra Leone (12.1%, a difference of 0.85%), and Spanish American Indian (12.1%, a difference of 1.3%).
| Demographics | Rating | Rank | Unemployment Among Ages 20 to 24 years |
| Immigrants | Armenia | 0.0 /100 | #295 | Tragic 12.0% |
| Cajuns | 0.0 /100 | #296 | Tragic 12.0% |
| Blackfeet | 0.0 /100 | #297 | Tragic 12.0% |
| Lumbee | 0.0 /100 | #298 | Tragic 12.0% |
| Apache | 0.0 /100 | #299 | Tragic 12.0% |
| Spanish American Indians | 0.0 /100 | #300 | Tragic 12.1% |
| Immigrants | Sierra Leone | 0.0 /100 | #301 | Tragic 12.1% |
| Immigrants | Cabo Verde | 0.0 /100 | #302 | Tragic 12.2% |
| Haitians | 0.0 /100 | #303 | Tragic 12.2% |
| Immigrants | West Indies | 0.0 /100 | #304 | Tragic 12.3% |
| Chippewa | 0.0 /100 | #305 | Tragic 12.3% |
| Immigrants | Haiti | 0.0 /100 | #306 | Tragic 12.4% |
| Bermudans | 0.0 /100 | #307 | Tragic 12.5% |
| Tohono O'odham | 0.0 /100 | #308 | Tragic 12.5% |
| Immigrants | Bangladesh | 0.0 /100 | #309 | Tragic 12.6% |