Central American vs American 3rd Grade
COMPARE
Central American
American
3rd Grade
3rd Grade Comparison
Central Americans
Americans
96.1%
3RD GRADE
0.0/ 100
METRIC RATING
337th/ 347
METRIC RANK
98.3%
3RD GRADE
99.8/ 100
METRIC RATING
55th/ 347
METRIC RANK
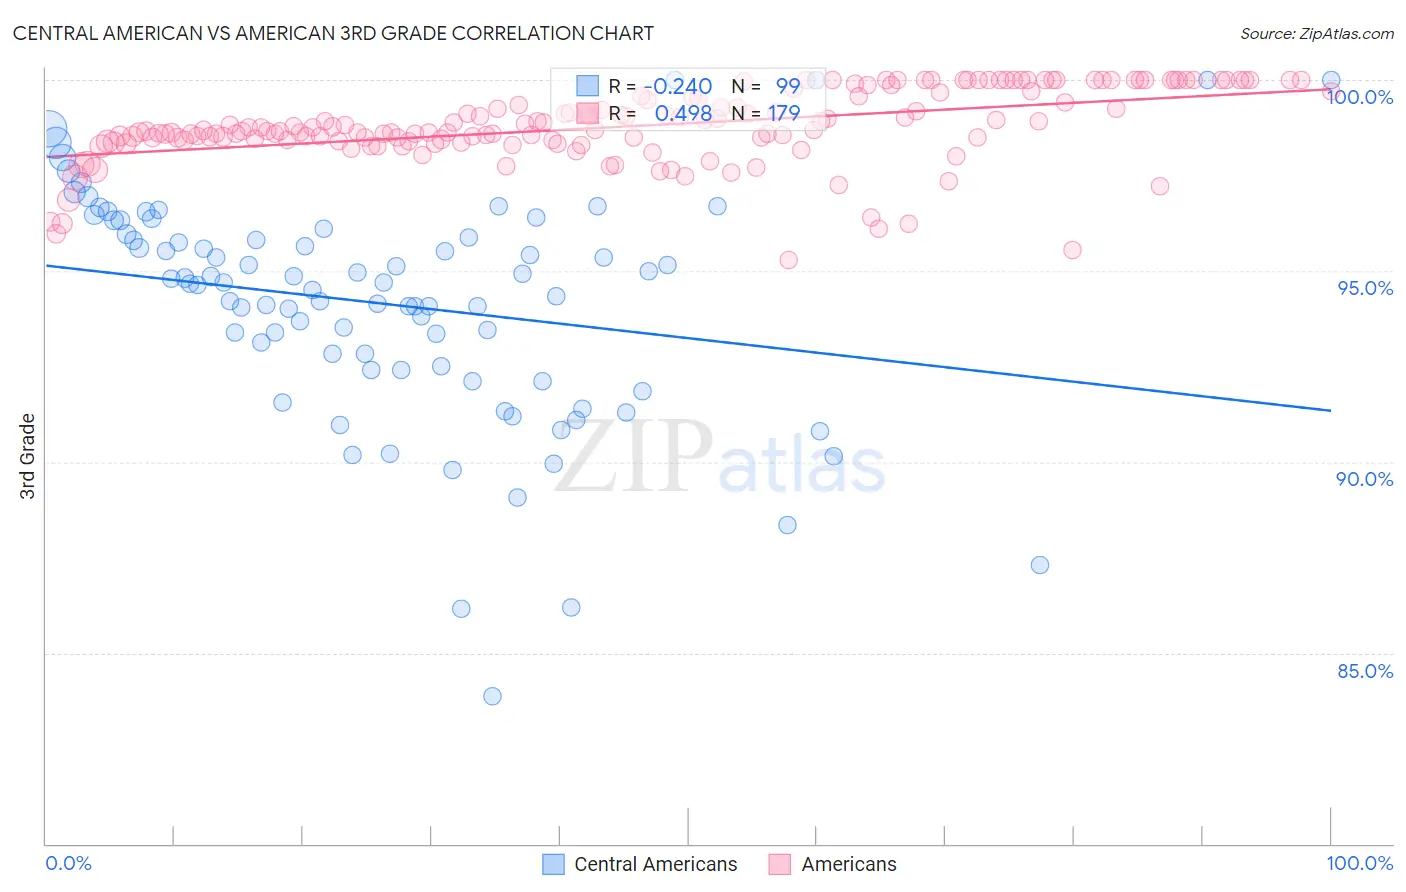
Central American vs American 3rd Grade Correlation Chart
The statistical analysis conducted on geographies consisting of 504,619,275 people shows a weak negative correlation between the proportion of Central Americans and percentage of population with at least 3rd grade education in the United States with a correlation coefficient (R) of -0.240 and weighted average of 96.1%. Similarly, the statistical analysis conducted on geographies consisting of 581,990,776 people shows a moderate positive correlation between the proportion of Americans and percentage of population with at least 3rd grade education in the United States with a correlation coefficient (R) of 0.498 and weighted average of 98.3%, a difference of 2.3%.
3rd Grade Correlation Summary
| Measurement | Central American | American |
| Minimum | 83.9% | 95.3% |
| Maximum | 100.0% | 100.0% |
| Range | 16.1% | 4.7% |
| Mean | 94.1% | 98.8% |
| Median | 94.7% | 98.7% |
| Interquartile 25% (IQ1) | 92.4% | 98.4% |
| Interquartile 75% (IQ3) | 96.0% | 99.6% |
| Interquartile Range (IQR) | 3.6% | 1.2% |
| Standard Deviation (Sample) | 3.0% | 0.96% |
| Standard Deviation (Population) | 3.0% | 0.96% |
Similar Demographics by 3rd Grade
Demographics Similar to Central Americans by 3rd Grade
In terms of 3rd grade, the demographic groups most similar to Central Americans are Immigrants from Cabo Verde (96.2%, a difference of 0.080%), Immigrants from Cambodia (96.2%, a difference of 0.10%), Immigrants from Dominican Republic (96.2%, a difference of 0.10%), Immigrants from Fiji (96.2%, a difference of 0.12%), and Guatemalan (96.0%, a difference of 0.12%).
| Demographics | Rating | Rank | 3rd Grade |
| Immigrants | Armenia | 0.0 /100 | #330 | Tragic 96.3% |
| Immigrants | Latin America | 0.0 /100 | #331 | Tragic 96.2% |
| Mexicans | 0.0 /100 | #332 | Tragic 96.2% |
| Immigrants | Fiji | 0.0 /100 | #333 | Tragic 96.2% |
| Immigrants | Cambodia | 0.0 /100 | #334 | Tragic 96.2% |
| Immigrants | Dominican Republic | 0.0 /100 | #335 | Tragic 96.2% |
| Immigrants | Cabo Verde | 0.0 /100 | #336 | Tragic 96.2% |
| Central Americans | 0.0 /100 | #337 | Tragic 96.1% |
| Guatemalans | 0.0 /100 | #338 | Tragic 96.0% |
| Yakama | 0.0 /100 | #339 | Tragic 95.9% |
| Nepalese | 0.0 /100 | #340 | Tragic 95.9% |
| Immigrants | Central America | 0.0 /100 | #341 | Tragic 95.8% |
| Immigrants | Guatemala | 0.0 /100 | #342 | Tragic 95.8% |
| Immigrants | Mexico | 0.0 /100 | #343 | Tragic 95.8% |
| Salvadorans | 0.0 /100 | #344 | Tragic 95.7% |
Demographics Similar to Americans by 3rd Grade
In terms of 3rd grade, the demographic groups most similar to Americans are Bulgarian (98.3%, a difference of 0.0%), Austrian (98.3%, a difference of 0.0%), Slavic (98.3%, a difference of 0.0%), Immigrants from Scotland (98.3%, a difference of 0.010%), and Greek (98.3%, a difference of 0.010%).
| Demographics | Rating | Rank | 3rd Grade |
| Lumbee | 99.8 /100 | #48 | Exceptional 98.3% |
| Estonians | 99.8 /100 | #49 | Exceptional 98.3% |
| Celtics | 99.8 /100 | #50 | Exceptional 98.3% |
| Australians | 99.8 /100 | #51 | Exceptional 98.3% |
| Whites/Caucasians | 99.8 /100 | #52 | Exceptional 98.3% |
| Immigrants | Scotland | 99.8 /100 | #53 | Exceptional 98.3% |
| Bulgarians | 99.8 /100 | #54 | Exceptional 98.3% |
| Americans | 99.8 /100 | #55 | Exceptional 98.3% |
| Austrians | 99.8 /100 | #56 | Exceptional 98.3% |
| Slavs | 99.7 /100 | #57 | Exceptional 98.3% |
| Greeks | 99.7 /100 | #58 | Exceptional 98.3% |
| Maltese | 99.7 /100 | #59 | Exceptional 98.3% |
| Creek | 99.7 /100 | #60 | Exceptional 98.2% |
| Pueblo | 99.7 /100 | #61 | Exceptional 98.2% |
| Immigrants | Canada | 99.7 /100 | #62 | Exceptional 98.2% |