Central American Indian vs Immigrants from Armenia Divorced or Separated
COMPARE
Central American Indian
Immigrants from Armenia
Divorced or Separated
Divorced or Separated Comparison
Central American Indians
Immigrants from Armenia
12.7%
DIVORCED OR SEPARATED
0.3/ 100
METRIC RATING
275th/ 347
METRIC RANK
10.6%
DIVORCED OR SEPARATED
100.0/ 100
METRIC RATING
15th/ 347
METRIC RANK
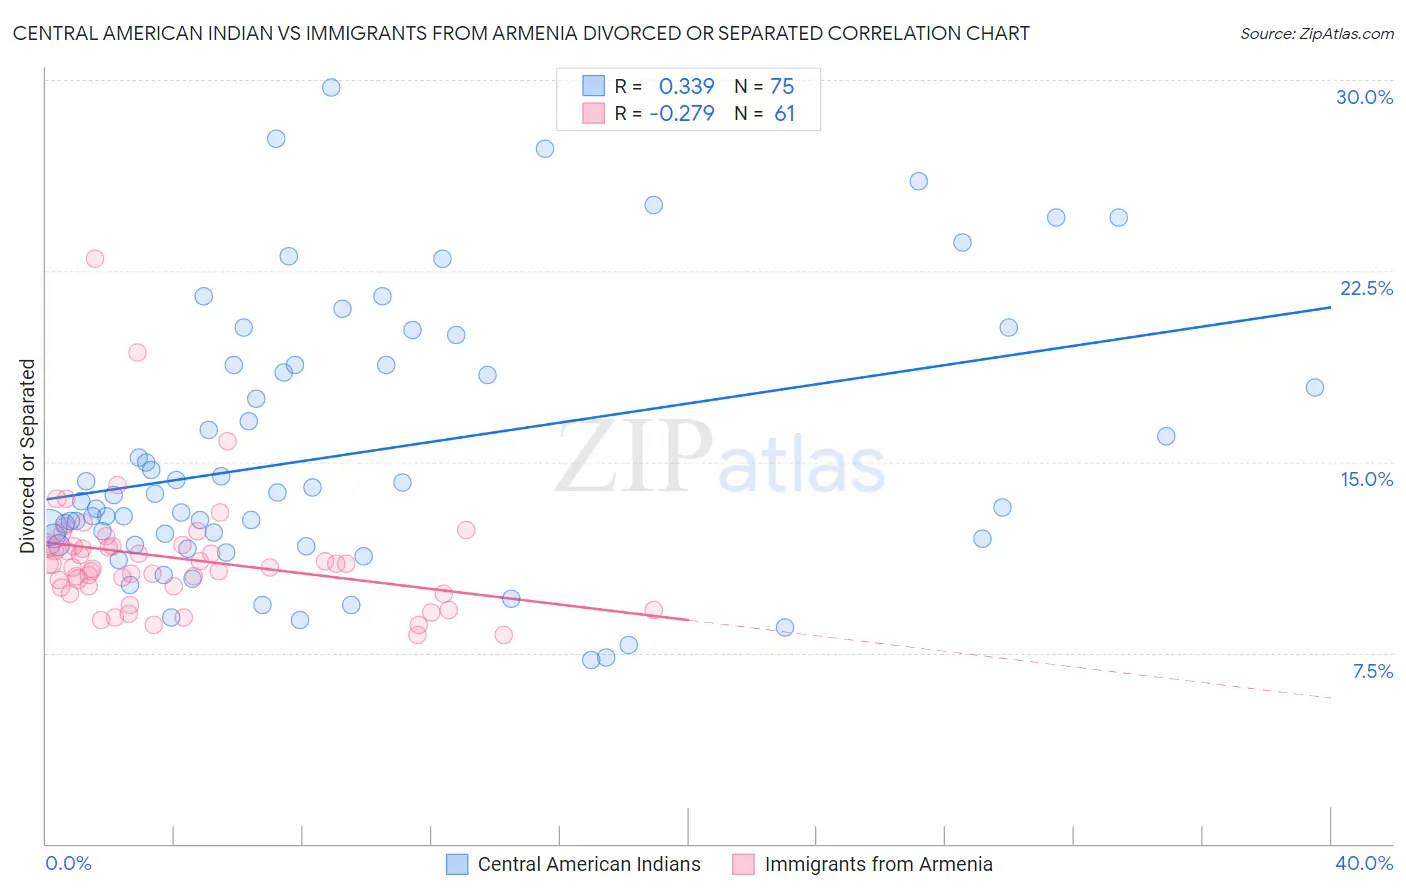
Central American Indian vs Immigrants from Armenia Divorced or Separated Correlation Chart
The statistical analysis conducted on geographies consisting of 326,087,171 people shows a mild positive correlation between the proportion of Central American Indians and percentage of population currently divorced or separated in the United States with a correlation coefficient (R) of 0.339 and weighted average of 12.7%. Similarly, the statistical analysis conducted on geographies consisting of 97,716,908 people shows a weak negative correlation between the proportion of Immigrants from Armenia and percentage of population currently divorced or separated in the United States with a correlation coefficient (R) of -0.279 and weighted average of 10.6%, a difference of 20.0%.
Divorced or Separated Correlation Summary
| Measurement | Central American Indian | Immigrants from Armenia |
| Minimum | 7.2% | 8.2% |
| Maximum | 29.7% | 23.0% |
| Range | 22.5% | 14.8% |
| Mean | 15.3% | 11.2% |
| Median | 13.7% | 11.0% |
| Interquartile 25% (IQ1) | 11.7% | 10.1% |
| Interquartile 75% (IQ3) | 18.8% | 11.7% |
| Interquartile Range (IQR) | 7.1% | 1.6% |
| Standard Deviation (Sample) | 5.3% | 2.4% |
| Standard Deviation (Population) | 5.3% | 2.4% |
Similar Demographics by Divorced or Separated
Demographics Similar to Central American Indians by Divorced or Separated
In terms of divorced or separated, the demographic groups most similar to Central American Indians are Bermudan (12.7%, a difference of 0.020%), Immigrants from Micronesia (12.7%, a difference of 0.040%), Spaniard (12.7%, a difference of 0.060%), Dominican (12.7%, a difference of 0.11%), and Immigrants from Middle Africa (12.7%, a difference of 0.16%).
| Demographics | Rating | Rank | Divorced or Separated |
| Fijians | 0.4 /100 | #268 | Tragic 12.6% |
| Immigrants | Liberia | 0.4 /100 | #269 | Tragic 12.6% |
| Ute | 0.4 /100 | #270 | Tragic 12.6% |
| Panamanians | 0.3 /100 | #271 | Tragic 12.7% |
| Immigrants | Middle Africa | 0.3 /100 | #272 | Tragic 12.7% |
| Immigrants | Micronesia | 0.3 /100 | #273 | Tragic 12.7% |
| Bermudans | 0.3 /100 | #274 | Tragic 12.7% |
| Central American Indians | 0.3 /100 | #275 | Tragic 12.7% |
| Spaniards | 0.2 /100 | #276 | Tragic 12.7% |
| Dominicans | 0.2 /100 | #277 | Tragic 12.7% |
| Lumbee | 0.2 /100 | #278 | Tragic 12.7% |
| Immigrants | Dominican Republic | 0.2 /100 | #279 | Tragic 12.7% |
| Immigrants | Zaire | 0.2 /100 | #280 | Tragic 12.7% |
| Pueblo | 0.2 /100 | #281 | Tragic 12.7% |
| Sub-Saharan Africans | 0.1 /100 | #282 | Tragic 12.7% |
Demographics Similar to Immigrants from Armenia by Divorced or Separated
In terms of divorced or separated, the demographic groups most similar to Immigrants from Armenia are Assyrian/Chaldean/Syriac (10.6%, a difference of 0.070%), Immigrants from Korea (10.6%, a difference of 0.44%), Immigrants from Israel (10.6%, a difference of 0.55%), Immigrants from Iran (10.6%, a difference of 0.63%), and Asian (10.6%, a difference of 0.64%).
| Demographics | Rating | Rank | Divorced or Separated |
| Immigrants | Eastern Asia | 100.0 /100 | #8 | Exceptional 10.2% |
| Yup'ik | 100.0 /100 | #9 | Exceptional 10.3% |
| Immigrants | Singapore | 100.0 /100 | #10 | Exceptional 10.3% |
| Immigrants | South Central Asia | 100.0 /100 | #11 | Exceptional 10.4% |
| Okinawans | 100.0 /100 | #12 | Exceptional 10.5% |
| Cypriots | 100.0 /100 | #13 | Exceptional 10.5% |
| Assyrians/Chaldeans/Syriacs | 100.0 /100 | #14 | Exceptional 10.6% |
| Immigrants | Armenia | 100.0 /100 | #15 | Exceptional 10.6% |
| Immigrants | Korea | 100.0 /100 | #16 | Exceptional 10.6% |
| Immigrants | Israel | 100.0 /100 | #17 | Exceptional 10.6% |
| Immigrants | Iran | 100.0 /100 | #18 | Exceptional 10.6% |
| Asians | 100.0 /100 | #19 | Exceptional 10.6% |
| Burmese | 100.0 /100 | #20 | Exceptional 10.7% |
| Immigrants | Asia | 100.0 /100 | #21 | Exceptional 10.7% |
| Vietnamese | 100.0 /100 | #22 | Exceptional 10.8% |