Immigrants from Oceania vs Bahamian Average Family Size
COMPARE
Immigrants from Oceania
Bahamian
Average Family Size
Average Family Size Comparison
Immigrants from Oceania
Bahamians
3.29
AVERAGE FAMILY SIZE
98.7/ 100
METRIC RATING
97th/ 347
METRIC RANK
3.28
AVERAGE FAMILY SIZE
96.6/ 100
METRIC RATING
110th/ 347
METRIC RANK
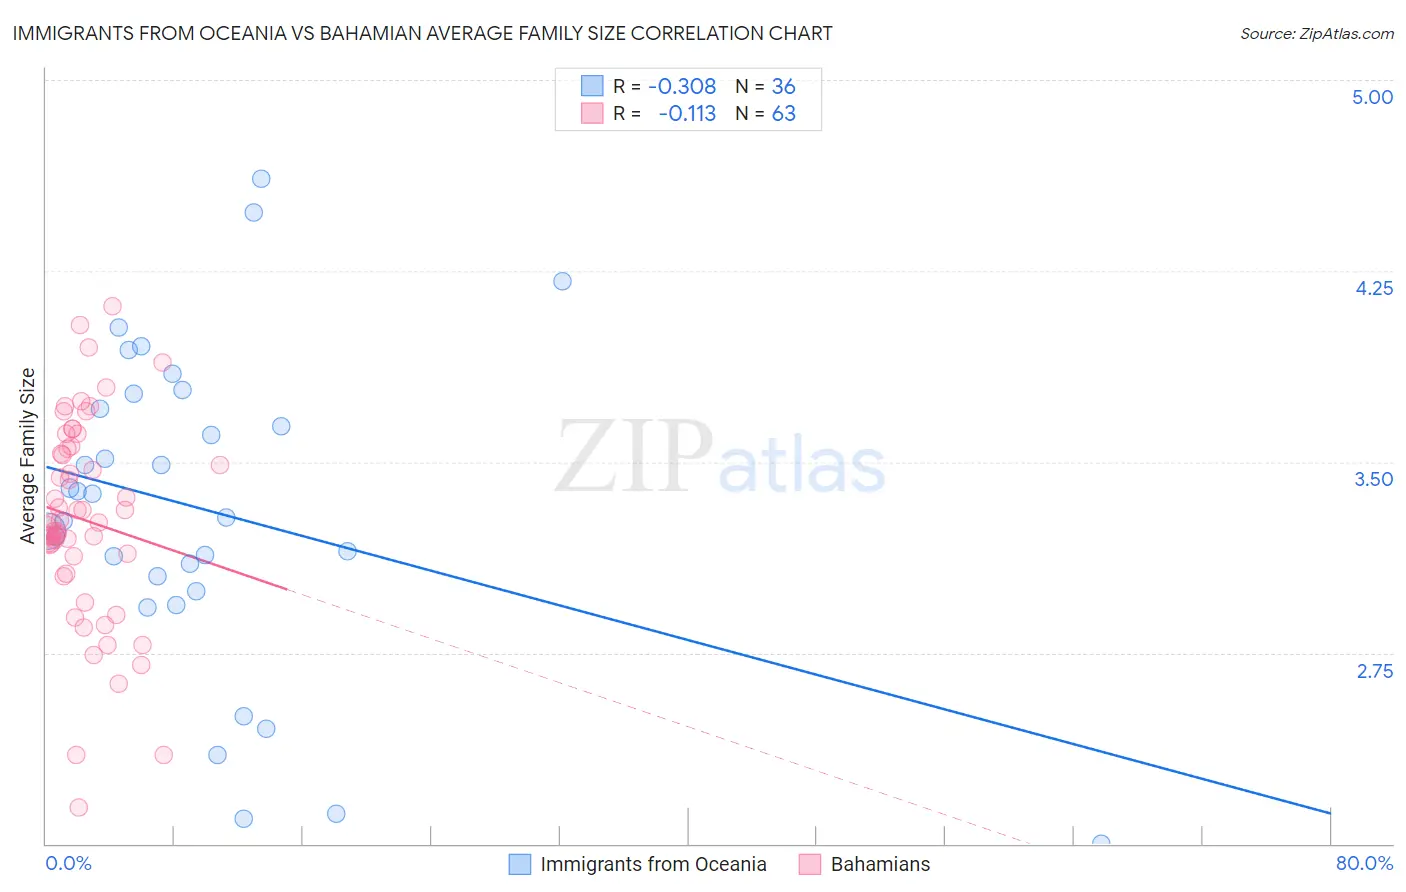
Immigrants from Oceania vs Bahamian Average Family Size Correlation Chart
The statistical analysis conducted on geographies consisting of 305,389,085 people shows a mild negative correlation between the proportion of Immigrants from Oceania and average family size in the United States with a correlation coefficient (R) of -0.308 and weighted average of 3.29. Similarly, the statistical analysis conducted on geographies consisting of 112,635,727 people shows a poor negative correlation between the proportion of Bahamians and average family size in the United States with a correlation coefficient (R) of -0.113 and weighted average of 3.28, a difference of 0.43%.
Average Family Size Correlation Summary
| Measurement | Immigrants from Oceania | Bahamian |
| Minimum | 2.00 | 2.14 |
| Maximum | 4.61 | 4.11 |
| Range | 2.61 | 1.97 |
| Mean | 3.31 | 3.27 |
| Median | 3.33 | 3.26 |
| Interquartile 25% (IQ1) | 3.02 | 3.13 |
| Interquartile 75% (IQ3) | 3.74 | 3.55 |
| Interquartile Range (IQR) | 0.71 | 0.42 |
| Standard Deviation (Sample) | 0.63 | 0.40 |
| Standard Deviation (Population) | 0.62 | 0.39 |
Demographics Similar to Immigrants from Oceania and Bahamians by Average Family Size
In terms of average family size, the demographic groups most similar to Immigrants from Oceania are Barbadian (3.29, a difference of 0.0%), Nigerian (3.29, a difference of 0.010%), Guamanian/Chamorro (3.29, a difference of 0.010%), Immigrants from Burma/Myanmar (3.29, a difference of 0.030%), and U.S. Virgin Islander (3.29, a difference of 0.040%). Similarly, the demographic groups most similar to Bahamians are Puerto Rican (3.28, a difference of 0.020%), Indonesian (3.28, a difference of 0.050%), Asian (3.28, a difference of 0.060%), Black/African American (3.27, a difference of 0.11%), and Immigrants from Panama (3.27, a difference of 0.12%).
| Demographics | Rating | Rank | Average Family Size |
| Peruvians | 99.2 /100 | #93 | Exceptional 3.30 |
| Sierra Leoneans | 99.0 /100 | #94 | Exceptional 3.30 |
| Immigrants | Lebanon | 99.0 /100 | #95 | Exceptional 3.30 |
| U.S. Virgin Islanders | 98.8 /100 | #96 | Exceptional 3.29 |
| Immigrants | Oceania | 98.7 /100 | #97 | Exceptional 3.29 |
| Barbadians | 98.6 /100 | #98 | Exceptional 3.29 |
| Nigerians | 98.6 /100 | #99 | Exceptional 3.29 |
| Guamanians/Chamorros | 98.6 /100 | #100 | Exceptional 3.29 |
| Immigrants | Burma/Myanmar | 98.6 /100 | #101 | Exceptional 3.29 |
| West Indians | 98.5 /100 | #102 | Exceptional 3.29 |
| Immigrants | Western Africa | 98.4 /100 | #103 | Exceptional 3.29 |
| Bolivians | 98.3 /100 | #104 | Exceptional 3.29 |
| Immigrants | Ghana | 98.1 /100 | #105 | Exceptional 3.29 |
| Paiute | 98.0 /100 | #106 | Exceptional 3.29 |
| Ghanaians | 98.0 /100 | #107 | Exceptional 3.29 |
| Asians | 97.0 /100 | #108 | Exceptional 3.28 |
| Puerto Ricans | 96.7 /100 | #109 | Exceptional 3.28 |
| Bahamians | 96.6 /100 | #110 | Exceptional 3.28 |
| Indonesians | 96.2 /100 | #111 | Exceptional 3.28 |
| Blacks/African Americans | 95.7 /100 | #112 | Exceptional 3.27 |
| Immigrants | Panama | 95.6 /100 | #113 | Exceptional 3.27 |