Brazilian vs Bahamian Average Family Size
COMPARE
Brazilian
Bahamian
Average Family Size
Average Family Size Comparison
Brazilians
Bahamians
3.18
AVERAGE FAMILY SIZE
4.5/ 100
METRIC RATING
233rd/ 347
METRIC RANK
3.28
AVERAGE FAMILY SIZE
96.6/ 100
METRIC RATING
110th/ 347
METRIC RANK
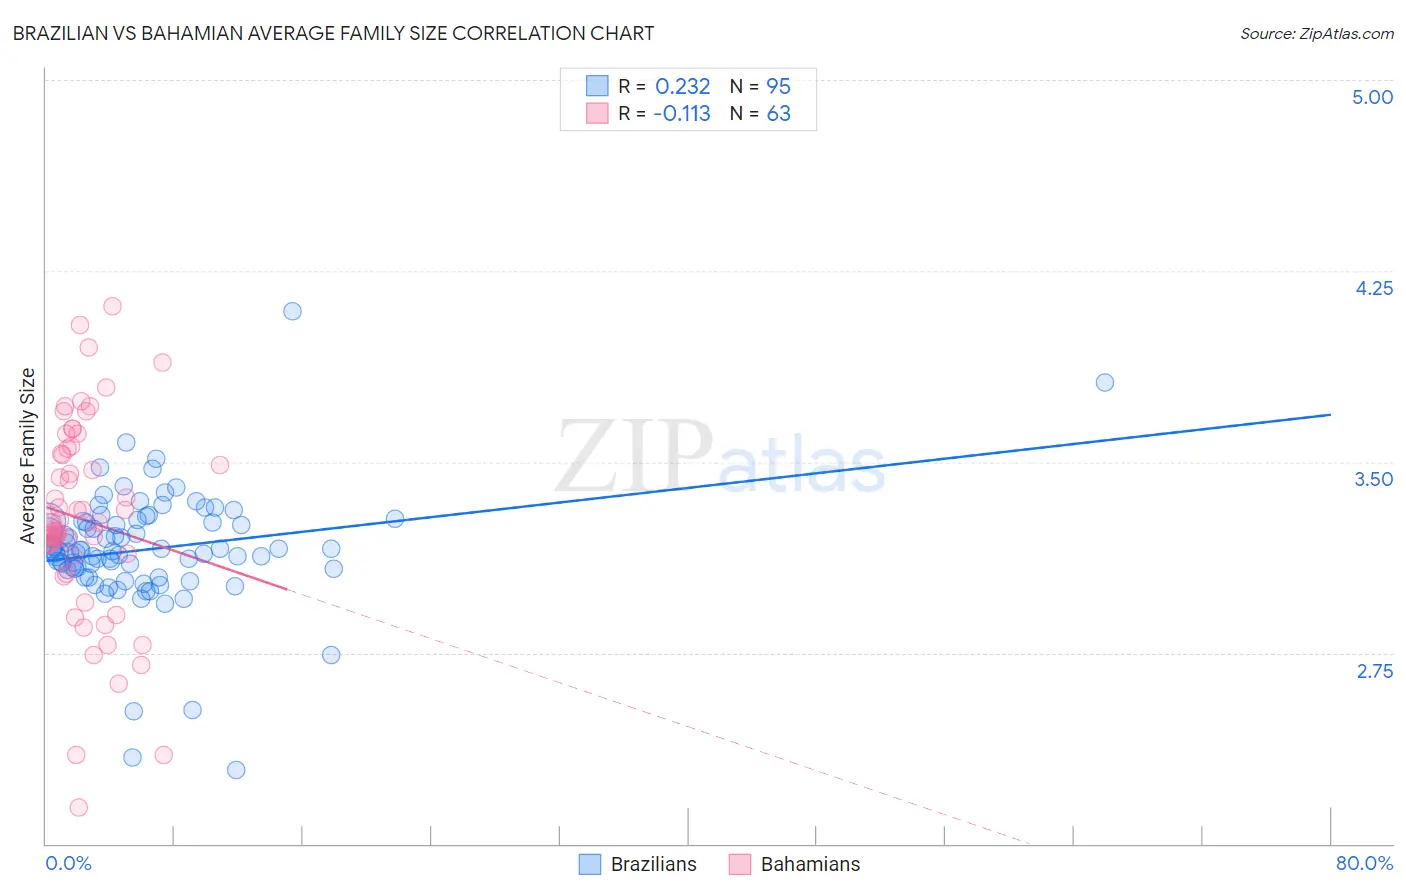
Brazilian vs Bahamian Average Family Size Correlation Chart
The statistical analysis conducted on geographies consisting of 323,732,012 people shows a weak positive correlation between the proportion of Brazilians and average family size in the United States with a correlation coefficient (R) of 0.232 and weighted average of 3.18. Similarly, the statistical analysis conducted on geographies consisting of 112,635,727 people shows a poor negative correlation between the proportion of Bahamians and average family size in the United States with a correlation coefficient (R) of -0.113 and weighted average of 3.28, a difference of 3.0%.
Average Family Size Correlation Summary
| Measurement | Brazilian | Bahamian |
| Minimum | 2.29 | 2.14 |
| Maximum | 4.09 | 4.11 |
| Range | 1.80 | 1.97 |
| Mean | 3.16 | 3.27 |
| Median | 3.15 | 3.26 |
| Interquartile 25% (IQ1) | 3.08 | 3.13 |
| Interquartile 75% (IQ3) | 3.26 | 3.55 |
| Interquartile Range (IQR) | 0.19 | 0.42 |
| Standard Deviation (Sample) | 0.24 | 0.40 |
| Standard Deviation (Population) | 0.24 | 0.39 |
Similar Demographics by Average Family Size
Demographics Similar to Brazilians by Average Family Size
In terms of average family size, the demographic groups most similar to Brazilians are Iranian (3.18, a difference of 0.0%), Cherokee (3.18, a difference of 0.020%), Immigrants from Turkey (3.18, a difference of 0.030%), Immigrants from Portugal (3.18, a difference of 0.040%), and Icelander (3.19, a difference of 0.070%).
| Demographics | Rating | Rank | Average Family Size |
| Chickasaw | 6.0 /100 | #226 | Tragic 3.19 |
| Portuguese | 6.0 /100 | #227 | Tragic 3.19 |
| Immigrants | Nonimmigrants | 5.7 /100 | #228 | Tragic 3.19 |
| Immigrants | Italy | 5.3 /100 | #229 | Tragic 3.19 |
| Icelanders | 5.2 /100 | #230 | Tragic 3.19 |
| Basques | 5.2 /100 | #231 | Tragic 3.19 |
| Cherokee | 4.7 /100 | #232 | Tragic 3.18 |
| Brazilians | 4.5 /100 | #233 | Tragic 3.18 |
| Iranians | 4.5 /100 | #234 | Tragic 3.18 |
| Immigrants | Turkey | 4.2 /100 | #235 | Tragic 3.18 |
| Immigrants | Portugal | 4.2 /100 | #236 | Tragic 3.18 |
| Immigrants | Romania | 3.7 /100 | #237 | Tragic 3.18 |
| Romanians | 3.7 /100 | #238 | Tragic 3.18 |
| Houma | 3.4 /100 | #239 | Tragic 3.18 |
| Osage | 3.2 /100 | #240 | Tragic 3.18 |
Demographics Similar to Bahamians by Average Family Size
In terms of average family size, the demographic groups most similar to Bahamians are Puerto Rican (3.28, a difference of 0.020%), Indonesian (3.28, a difference of 0.050%), Asian (3.28, a difference of 0.060%), Black/African American (3.27, a difference of 0.11%), and Immigrants from Panama (3.27, a difference of 0.12%).
| Demographics | Rating | Rank | Average Family Size |
| Immigrants | Western Africa | 98.4 /100 | #103 | Exceptional 3.29 |
| Bolivians | 98.3 /100 | #104 | Exceptional 3.29 |
| Immigrants | Ghana | 98.1 /100 | #105 | Exceptional 3.29 |
| Paiute | 98.0 /100 | #106 | Exceptional 3.29 |
| Ghanaians | 98.0 /100 | #107 | Exceptional 3.29 |
| Asians | 97.0 /100 | #108 | Exceptional 3.28 |
| Puerto Ricans | 96.7 /100 | #109 | Exceptional 3.28 |
| Bahamians | 96.6 /100 | #110 | Exceptional 3.28 |
| Indonesians | 96.2 /100 | #111 | Exceptional 3.28 |
| Blacks/African Americans | 95.7 /100 | #112 | Exceptional 3.27 |
| Immigrants | Panama | 95.6 /100 | #113 | Exceptional 3.27 |
| South Americans | 95.1 /100 | #114 | Exceptional 3.27 |
| Immigrants | Liberia | 95.0 /100 | #115 | Exceptional 3.27 |
| Immigrants | South America | 95.0 /100 | #116 | Exceptional 3.27 |
| Kiowa | 94.8 /100 | #117 | Exceptional 3.27 |