Immigrants from Dominica vs Moroccan Divorced or Separated
COMPARE
Immigrants from Dominica
Moroccan
Divorced or Separated
Divorced or Separated Comparison
Immigrants from Dominica
Moroccans
12.6%
DIVORCED OR SEPARATED
0.5/ 100
METRIC RATING
261st/ 347
METRIC RANK
12.1%
DIVORCED OR SEPARATED
34.8/ 100
METRIC RATING
190th/ 347
METRIC RANK
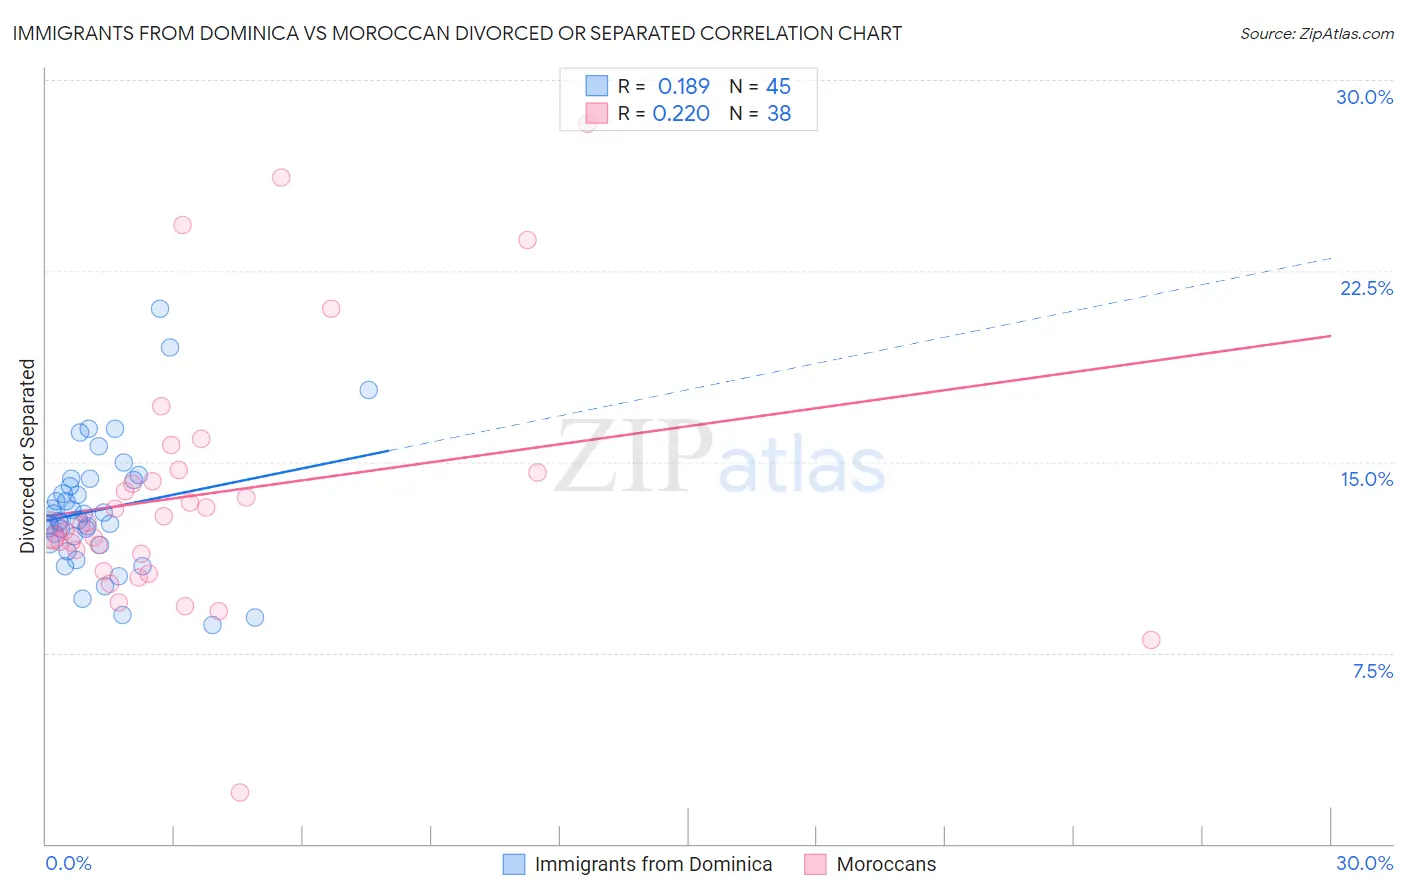
Immigrants from Dominica vs Moroccan Divorced or Separated Correlation Chart
The statistical analysis conducted on geographies consisting of 83,792,024 people shows a poor positive correlation between the proportion of Immigrants from Dominica and percentage of population currently divorced or separated in the United States with a correlation coefficient (R) of 0.189 and weighted average of 12.6%. Similarly, the statistical analysis conducted on geographies consisting of 201,776,444 people shows a weak positive correlation between the proportion of Moroccans and percentage of population currently divorced or separated in the United States with a correlation coefficient (R) of 0.220 and weighted average of 12.1%, a difference of 3.9%.
Divorced or Separated Correlation Summary
| Measurement | Immigrants from Dominica | Moroccan |
| Minimum | 8.6% | 2.0% |
| Maximum | 21.0% | 28.3% |
| Range | 12.4% | 26.3% |
| Mean | 13.1% | 13.7% |
| Median | 12.7% | 12.6% |
| Interquartile 25% (IQ1) | 11.8% | 11.4% |
| Interquartile 75% (IQ3) | 14.3% | 14.6% |
| Interquartile Range (IQR) | 2.5% | 3.2% |
| Standard Deviation (Sample) | 2.5% | 5.1% |
| Standard Deviation (Population) | 2.5% | 5.0% |
Similar Demographics by Divorced or Separated
Demographics Similar to Immigrants from Dominica by Divorced or Separated
In terms of divorced or separated, the demographic groups most similar to Immigrants from Dominica are Yuman (12.6%, a difference of 0.030%), Immigrants from Uruguay (12.6%, a difference of 0.030%), Immigrants from Somalia (12.6%, a difference of 0.050%), Indonesian (12.6%, a difference of 0.050%), and Basque (12.6%, a difference of 0.060%).
| Demographics | Rating | Rank | Divorced or Separated |
| Senegalese | 0.8 /100 | #254 | Tragic 12.6% |
| Welsh | 0.7 /100 | #255 | Tragic 12.6% |
| Immigrants | Colombia | 0.6 /100 | #256 | Tragic 12.6% |
| Immigrants | Somalia | 0.6 /100 | #257 | Tragic 12.6% |
| Indonesians | 0.6 /100 | #258 | Tragic 12.6% |
| Yuman | 0.6 /100 | #259 | Tragic 12.6% |
| Immigrants | Uruguay | 0.6 /100 | #260 | Tragic 12.6% |
| Immigrants | Dominica | 0.5 /100 | #261 | Tragic 12.6% |
| Basques | 0.5 /100 | #262 | Tragic 12.6% |
| Immigrants | Panama | 0.5 /100 | #263 | Tragic 12.6% |
| English | 0.5 /100 | #264 | Tragic 12.6% |
| Immigrants | Senegal | 0.5 /100 | #265 | Tragic 12.6% |
| Whites/Caucasians | 0.5 /100 | #266 | Tragic 12.6% |
| Scottish | 0.4 /100 | #267 | Tragic 12.6% |
| Fijians | 0.4 /100 | #268 | Tragic 12.6% |
Demographics Similar to Moroccans by Divorced or Separated
In terms of divorced or separated, the demographic groups most similar to Moroccans are Swedish (12.1%, a difference of 0.020%), Sierra Leonean (12.1%, a difference of 0.030%), Norwegian (12.1%, a difference of 0.060%), Immigrants from Thailand (12.1%, a difference of 0.090%), and Immigrants from Belize (12.1%, a difference of 0.10%).
| Demographics | Rating | Rank | Divorced or Separated |
| Immigrants | Central America | 42.9 /100 | #183 | Average 12.1% |
| Immigrants | North America | 41.1 /100 | #184 | Average 12.1% |
| Immigrants | Nigeria | 40.5 /100 | #185 | Average 12.1% |
| Immigrants | Chile | 39.0 /100 | #186 | Fair 12.1% |
| Belizeans | 37.7 /100 | #187 | Fair 12.1% |
| Immigrants | Belize | 37.6 /100 | #188 | Fair 12.1% |
| Sierra Leoneans | 35.5 /100 | #189 | Fair 12.1% |
| Moroccans | 34.8 /100 | #190 | Fair 12.1% |
| Swedes | 34.4 /100 | #191 | Fair 12.1% |
| Norwegians | 33.2 /100 | #192 | Fair 12.1% |
| Immigrants | Thailand | 32.5 /100 | #193 | Fair 12.1% |
| Immigrants | Eritrea | 31.9 /100 | #194 | Fair 12.1% |
| Immigrants | England | 31.4 /100 | #195 | Fair 12.1% |
| Immigrants | Burma/Myanmar | 30.4 /100 | #196 | Fair 12.1% |
| Immigrants | Africa | 30.3 /100 | #197 | Fair 12.1% |