Canadian vs Moroccan High School Diploma
COMPARE
Canadian
Moroccan
High School Diploma
High School Diploma Comparison
Canadians
Moroccans
90.6%
HIGH SCHOOL DIPLOMA
98.7/ 100
METRIC RATING
89th/ 347
METRIC RANK
88.8%
HIGH SCHOOL DIPLOMA
29.5/ 100
METRIC RATING
192nd/ 347
METRIC RANK
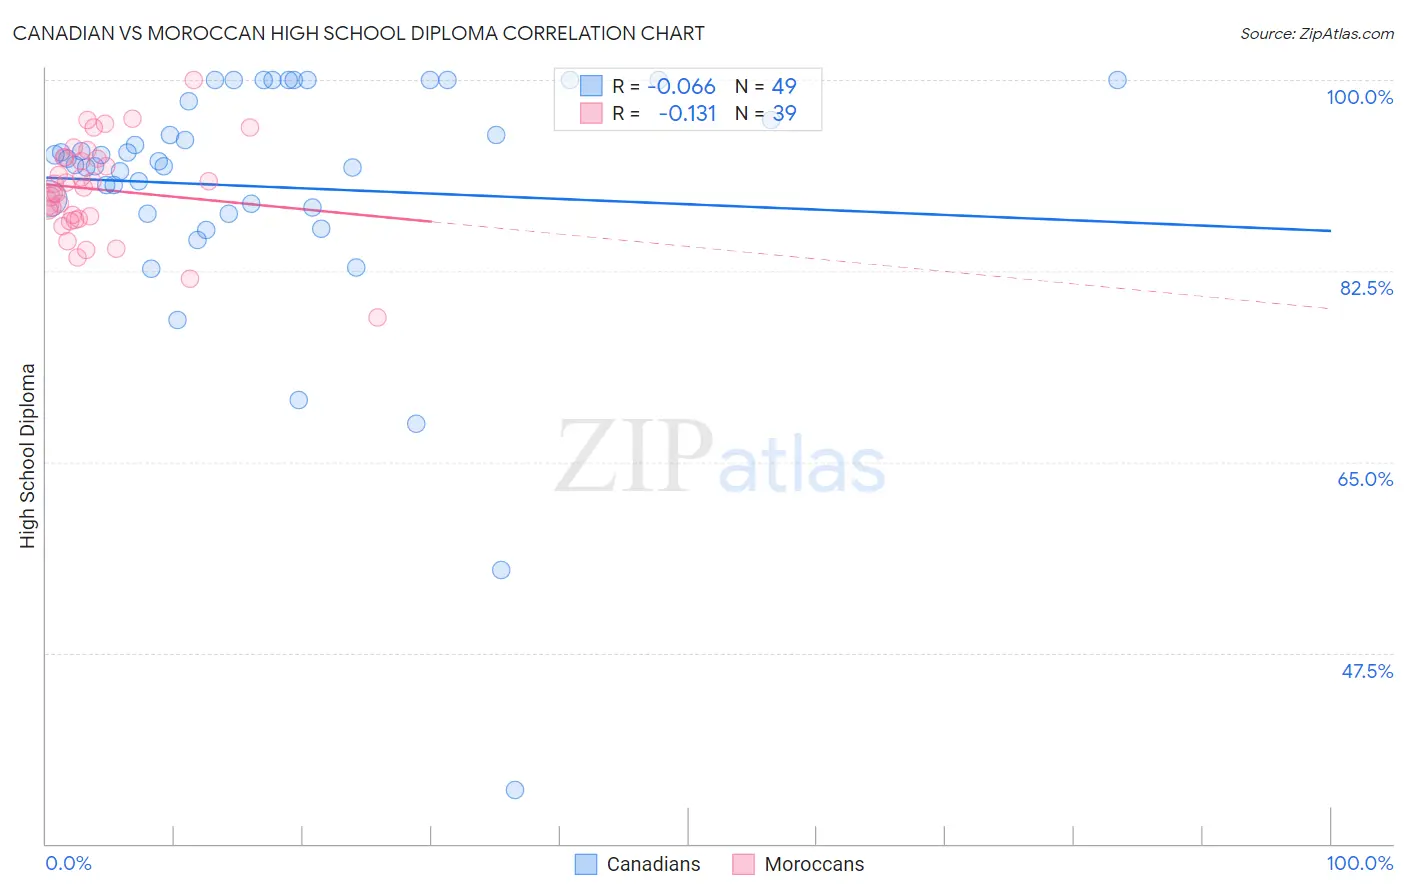
Canadian vs Moroccan High School Diploma Correlation Chart
The statistical analysis conducted on geographies consisting of 437,556,595 people shows a slight negative correlation between the proportion of Canadians and percentage of population with at least high school diploma education in the United States with a correlation coefficient (R) of -0.066 and weighted average of 90.6%. Similarly, the statistical analysis conducted on geographies consisting of 201,817,667 people shows a poor negative correlation between the proportion of Moroccans and percentage of population with at least high school diploma education in the United States with a correlation coefficient (R) of -0.131 and weighted average of 88.8%, a difference of 2.0%.
High School Diploma Correlation Summary
| Measurement | Canadian | Moroccan |
| Minimum | 34.9% | 78.3% |
| Maximum | 100.0% | 100.0% |
| Range | 65.1% | 21.7% |
| Mean | 90.2% | 90.0% |
| Median | 92.6% | 90.1% |
| Interquartile 25% (IQ1) | 88.1% | 87.3% |
| Interquartile 75% (IQ3) | 99.0% | 92.9% |
| Interquartile Range (IQR) | 11.0% | 5.5% |
| Standard Deviation (Sample) | 12.0% | 4.4% |
| Standard Deviation (Population) | 11.9% | 4.3% |
Similar Demographics by High School Diploma
Demographics Similar to Canadians by High School Diploma
In terms of high school diploma, the demographic groups most similar to Canadians are Celtic (90.6%, a difference of 0.010%), Immigrants from France (90.6%, a difference of 0.020%), South African (90.6%, a difference of 0.030%), Immigrants from Bulgaria (90.6%, a difference of 0.040%), and Immigrants from Turkey (90.6%, a difference of 0.040%).
| Demographics | Rating | Rank | High School Diploma |
| Scotch-Irish | 99.2 /100 | #82 | Exceptional 90.8% |
| Immigrants | Moldova | 99.2 /100 | #83 | Exceptional 90.7% |
| Immigrants | Saudi Arabia | 99.1 /100 | #84 | Exceptional 90.7% |
| Romanians | 98.9 /100 | #85 | Exceptional 90.7% |
| Immigrants | Bulgaria | 98.9 /100 | #86 | Exceptional 90.6% |
| Immigrants | Turkey | 98.9 /100 | #87 | Exceptional 90.6% |
| Immigrants | France | 98.8 /100 | #88 | Exceptional 90.6% |
| Canadians | 98.7 /100 | #89 | Exceptional 90.6% |
| Celtics | 98.7 /100 | #90 | Exceptional 90.6% |
| South Africans | 98.6 /100 | #91 | Exceptional 90.6% |
| Swiss | 98.6 /100 | #92 | Exceptional 90.6% |
| Immigrants | Western Europe | 98.6 /100 | #93 | Exceptional 90.6% |
| Immigrants | Israel | 98.5 /100 | #94 | Exceptional 90.5% |
| Icelanders | 98.5 /100 | #95 | Exceptional 90.5% |
| Immigrants | Serbia | 98.4 /100 | #96 | Exceptional 90.5% |
Demographics Similar to Moroccans by High School Diploma
In terms of high school diploma, the demographic groups most similar to Moroccans are Immigrants from Ethiopia (88.9%, a difference of 0.020%), Immigrants from Chile (88.9%, a difference of 0.040%), Immigrants from Uganda (88.9%, a difference of 0.050%), Immigrants from Oceania (88.8%, a difference of 0.050%), and Immigrants from Sudan (88.9%, a difference of 0.070%).
| Demographics | Rating | Rank | High School Diploma |
| Ethiopians | 37.0 /100 | #185 | Fair 89.0% |
| Immigrants | Eastern Africa | 35.8 /100 | #186 | Fair 88.9% |
| Guamanians/Chamorros | 35.5 /100 | #187 | Fair 88.9% |
| Immigrants | Sudan | 33.4 /100 | #188 | Fair 88.9% |
| Immigrants | Uganda | 32.6 /100 | #189 | Fair 88.9% |
| Immigrants | Chile | 31.9 /100 | #190 | Fair 88.9% |
| Immigrants | Ethiopia | 30.9 /100 | #191 | Fair 88.9% |
| Moroccans | 29.5 /100 | #192 | Fair 88.8% |
| Immigrants | Oceania | 26.9 /100 | #193 | Fair 88.8% |
| Immigrants | Venezuela | 25.8 /100 | #194 | Fair 88.8% |
| Afghans | 23.9 /100 | #195 | Fair 88.8% |
| Immigrants | Southern Europe | 23.4 /100 | #196 | Fair 88.7% |
| French American Indians | 21.5 /100 | #197 | Fair 88.7% |
| Liberians | 18.8 /100 | #198 | Poor 88.7% |
| Marshallese | 18.7 /100 | #199 | Poor 88.6% |