Cambodian vs American Currently Married
COMPARE
Cambodian
American
Currently Married
Currently Married Comparison
Cambodians
Americans
47.0%
CURRENTLY MARRIED
70.4/ 100
METRIC RATING
148th/ 347
METRIC RANK
48.0%
CURRENTLY MARRIED
95.7/ 100
METRIC RATING
90th/ 347
METRIC RANK
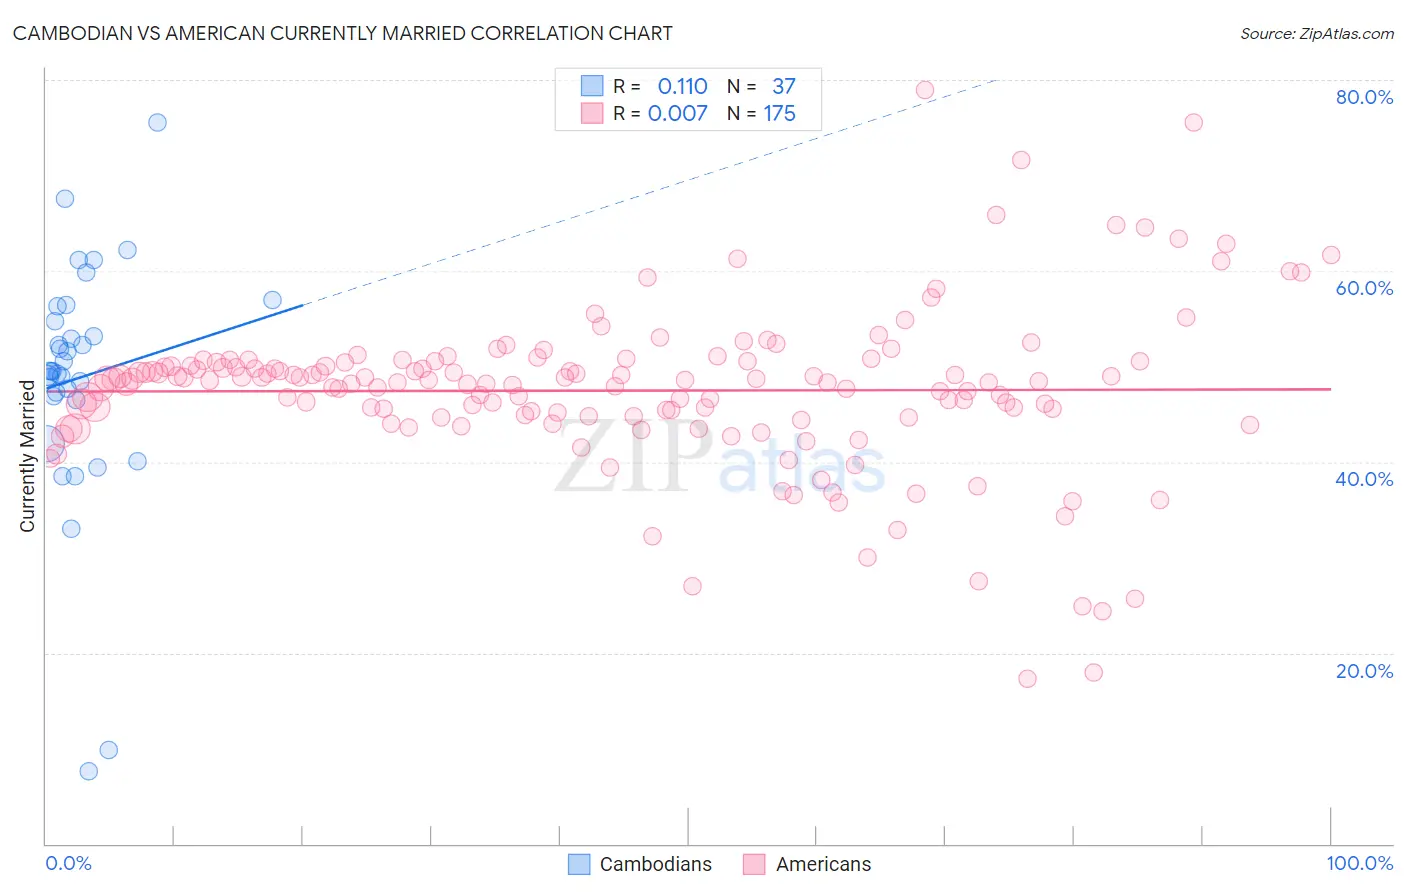
Cambodian vs American Currently Married Correlation Chart
The statistical analysis conducted on geographies consisting of 102,515,172 people shows a poor positive correlation between the proportion of Cambodians and percentage of population currently married in the United States with a correlation coefficient (R) of 0.110 and weighted average of 47.0%. Similarly, the statistical analysis conducted on geographies consisting of 581,851,049 people shows no correlation between the proportion of Americans and percentage of population currently married in the United States with a correlation coefficient (R) of 0.007 and weighted average of 48.0%, a difference of 2.0%.
Currently Married Correlation Summary
| Measurement | Cambodian | American |
| Minimum | 7.6% | 17.3% |
| Maximum | 75.6% | 79.0% |
| Range | 68.0% | 61.7% |
| Mean | 48.8% | 47.5% |
| Median | 49.5% | 48.4% |
| Interquartile 25% (IQ1) | 46.7% | 44.8% |
| Interquartile 75% (IQ3) | 55.5% | 50.5% |
| Interquartile Range (IQR) | 8.8% | 5.7% |
| Standard Deviation (Sample) | 12.8% | 8.5% |
| Standard Deviation (Population) | 12.6% | 8.5% |
Similar Demographics by Currently Married
Demographics Similar to Cambodians by Currently Married
In terms of currently married, the demographic groups most similar to Cambodians are Zimbabwean (47.0%, a difference of 0.010%), Immigrants from Turkey (47.0%, a difference of 0.010%), Chilean (47.0%, a difference of 0.030%), Immigrants from Argentina (47.0%, a difference of 0.070%), and Immigrants from Serbia (47.0%, a difference of 0.070%).
| Demographics | Rating | Rank | Currently Married |
| Venezuelans | 74.4 /100 | #141 | Good 47.1% |
| Argentineans | 74.4 /100 | #142 | Good 47.1% |
| Guamanians/Chamorros | 74.2 /100 | #143 | Good 47.1% |
| Hmong | 73.4 /100 | #144 | Good 47.1% |
| Immigrants | South Eastern Asia | 72.9 /100 | #145 | Good 47.1% |
| Carpatho Rusyns | 72.6 /100 | #146 | Good 47.0% |
| Immigrants | Argentina | 72.0 /100 | #147 | Good 47.0% |
| Cambodians | 70.4 /100 | #148 | Good 47.0% |
| Zimbabweans | 70.1 /100 | #149 | Good 47.0% |
| Immigrants | Turkey | 70.0 /100 | #150 | Good 47.0% |
| Chileans | 69.8 /100 | #151 | Good 47.0% |
| Immigrants | Serbia | 68.8 /100 | #152 | Good 47.0% |
| Immigrants | Venezuela | 68.6 /100 | #153 | Good 47.0% |
| Albanians | 68.6 /100 | #154 | Good 47.0% |
| Arabs | 68.6 /100 | #155 | Good 47.0% |
Demographics Similar to Americans by Currently Married
In terms of currently married, the demographic groups most similar to Americans are Indian (Asian) (48.0%, a difference of 0.020%), Immigrants from Bolivia (47.9%, a difference of 0.030%), Korean (47.9%, a difference of 0.070%), Immigrants from Eastern Europe (48.0%, a difference of 0.080%), and Jordanian (48.0%, a difference of 0.10%).
| Demographics | Rating | Rank | Currently Married |
| Bolivians | 96.9 /100 | #83 | Exceptional 48.1% |
| Immigrants | Israel | 96.9 /100 | #84 | Exceptional 48.1% |
| French Canadians | 96.3 /100 | #85 | Exceptional 48.0% |
| Immigrants | Japan | 96.2 /100 | #86 | Exceptional 48.0% |
| Jordanians | 96.2 /100 | #87 | Exceptional 48.0% |
| Immigrants | Eastern Europe | 96.1 /100 | #88 | Exceptional 48.0% |
| Indians (Asian) | 95.8 /100 | #89 | Exceptional 48.0% |
| Americans | 95.7 /100 | #90 | Exceptional 48.0% |
| Immigrants | Bolivia | 95.6 /100 | #91 | Exceptional 47.9% |
| Koreans | 95.4 /100 | #92 | Exceptional 47.9% |
| Lebanese | 95.1 /100 | #93 | Exceptional 47.9% |
| Native Hawaiians | 95.0 /100 | #94 | Exceptional 47.9% |
| Immigrants | Bulgaria | 94.8 /100 | #95 | Exceptional 47.9% |
| Egyptians | 94.8 /100 | #96 | Exceptional 47.9% |
| Immigrants | Ukraine | 94.8 /100 | #97 | Exceptional 47.9% |