Cambodian vs Immigrants from South Eastern Asia Currently Married
COMPARE
Cambodian
Immigrants from South Eastern Asia
Currently Married
Currently Married Comparison
Cambodians
Immigrants from South Eastern Asia
47.0%
CURRENTLY MARRIED
70.4/ 100
METRIC RATING
148th/ 347
METRIC RANK
47.1%
CURRENTLY MARRIED
72.9/ 100
METRIC RATING
145th/ 347
METRIC RANK
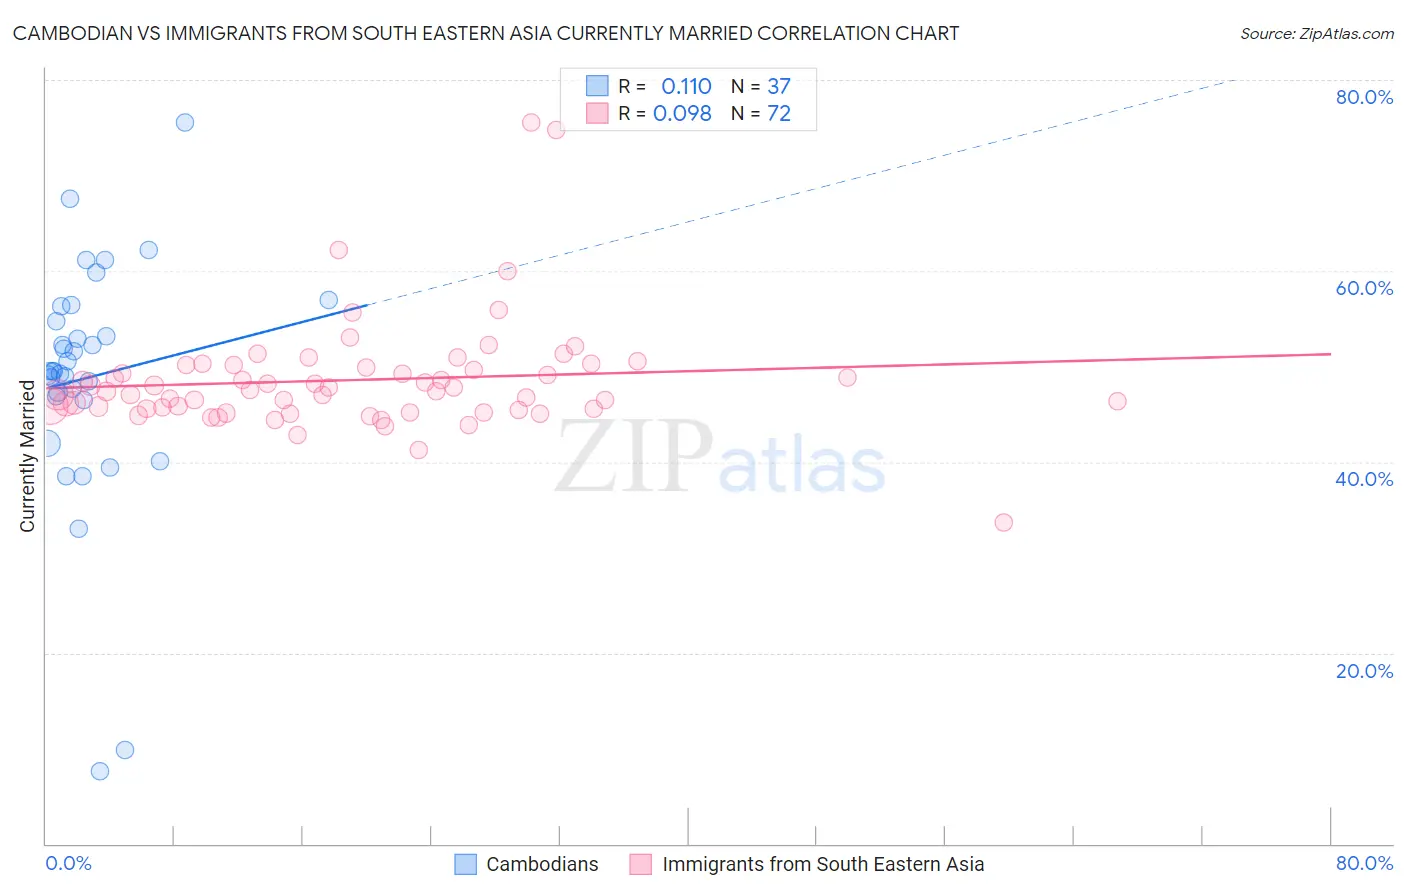
Cambodian vs Immigrants from South Eastern Asia Currently Married Correlation Chart
The statistical analysis conducted on geographies consisting of 102,515,172 people shows a poor positive correlation between the proportion of Cambodians and percentage of population currently married in the United States with a correlation coefficient (R) of 0.110 and weighted average of 47.0%. Similarly, the statistical analysis conducted on geographies consisting of 512,635,573 people shows a slight positive correlation between the proportion of Immigrants from South Eastern Asia and percentage of population currently married in the United States with a correlation coefficient (R) of 0.098 and weighted average of 47.1%, a difference of 0.11%.
Currently Married Correlation Summary
| Measurement | Cambodian | Immigrants from South Eastern Asia |
| Minimum | 7.6% | 33.6% |
| Maximum | 75.6% | 75.5% |
| Range | 68.0% | 41.9% |
| Mean | 48.8% | 48.6% |
| Median | 49.5% | 47.5% |
| Interquartile 25% (IQ1) | 46.7% | 45.6% |
| Interquartile 75% (IQ3) | 55.5% | 50.1% |
| Interquartile Range (IQR) | 8.8% | 4.5% |
| Standard Deviation (Sample) | 12.8% | 6.0% |
| Standard Deviation (Population) | 12.6% | 5.9% |
Demographics Similar to Cambodians and Immigrants from South Eastern Asia by Currently Married
In terms of currently married, the demographic groups most similar to Cambodians are Zimbabwean (47.0%, a difference of 0.010%), Immigrants from Turkey (47.0%, a difference of 0.010%), Chilean (47.0%, a difference of 0.030%), Immigrants from Argentina (47.0%, a difference of 0.070%), and Immigrants from Serbia (47.0%, a difference of 0.070%). Similarly, the demographic groups most similar to Immigrants from South Eastern Asia are Carpatho Rusyn (47.0%, a difference of 0.010%), Hmong (47.1%, a difference of 0.030%), Immigrants from Argentina (47.0%, a difference of 0.040%), Guamanian/Chamorro (47.1%, a difference of 0.060%), and Venezuelan (47.1%, a difference of 0.070%).
| Demographics | Rating | Rank | Currently Married |
| Immigrants | Vietnam | 78.2 /100 | #136 | Good 47.2% |
| Paraguayans | 77.8 /100 | #137 | Good 47.2% |
| Pakistanis | 77.5 /100 | #138 | Good 47.2% |
| Yugoslavians | 77.4 /100 | #139 | Good 47.2% |
| Cajuns | 75.3 /100 | #140 | Good 47.1% |
| Venezuelans | 74.4 /100 | #141 | Good 47.1% |
| Argentineans | 74.4 /100 | #142 | Good 47.1% |
| Guamanians/Chamorros | 74.2 /100 | #143 | Good 47.1% |
| Hmong | 73.4 /100 | #144 | Good 47.1% |
| Immigrants | South Eastern Asia | 72.9 /100 | #145 | Good 47.1% |
| Carpatho Rusyns | 72.6 /100 | #146 | Good 47.0% |
| Immigrants | Argentina | 72.0 /100 | #147 | Good 47.0% |
| Cambodians | 70.4 /100 | #148 | Good 47.0% |
| Zimbabweans | 70.1 /100 | #149 | Good 47.0% |
| Immigrants | Turkey | 70.0 /100 | #150 | Good 47.0% |
| Chileans | 69.8 /100 | #151 | Good 47.0% |
| Immigrants | Serbia | 68.8 /100 | #152 | Good 47.0% |
| Immigrants | Venezuela | 68.6 /100 | #153 | Good 47.0% |
| Albanians | 68.6 /100 | #154 | Good 47.0% |
| Arabs | 68.6 /100 | #155 | Good 47.0% |
| Spanish | 68.1 /100 | #156 | Good 47.0% |