Cambodian vs Immigrants from Italy Disability Age Over 75
COMPARE
Cambodian
Immigrants from Italy
Disability Age Over 75
Disability Age Over 75 Comparison
Cambodians
Immigrants from Italy
46.1%
DISABILITY AGE OVER 75
99.1/ 100
METRIC RATING
73rd/ 347
METRIC RANK
45.8%
DISABILITY AGE OVER 75
99.7/ 100
METRIC RATING
53rd/ 347
METRIC RANK
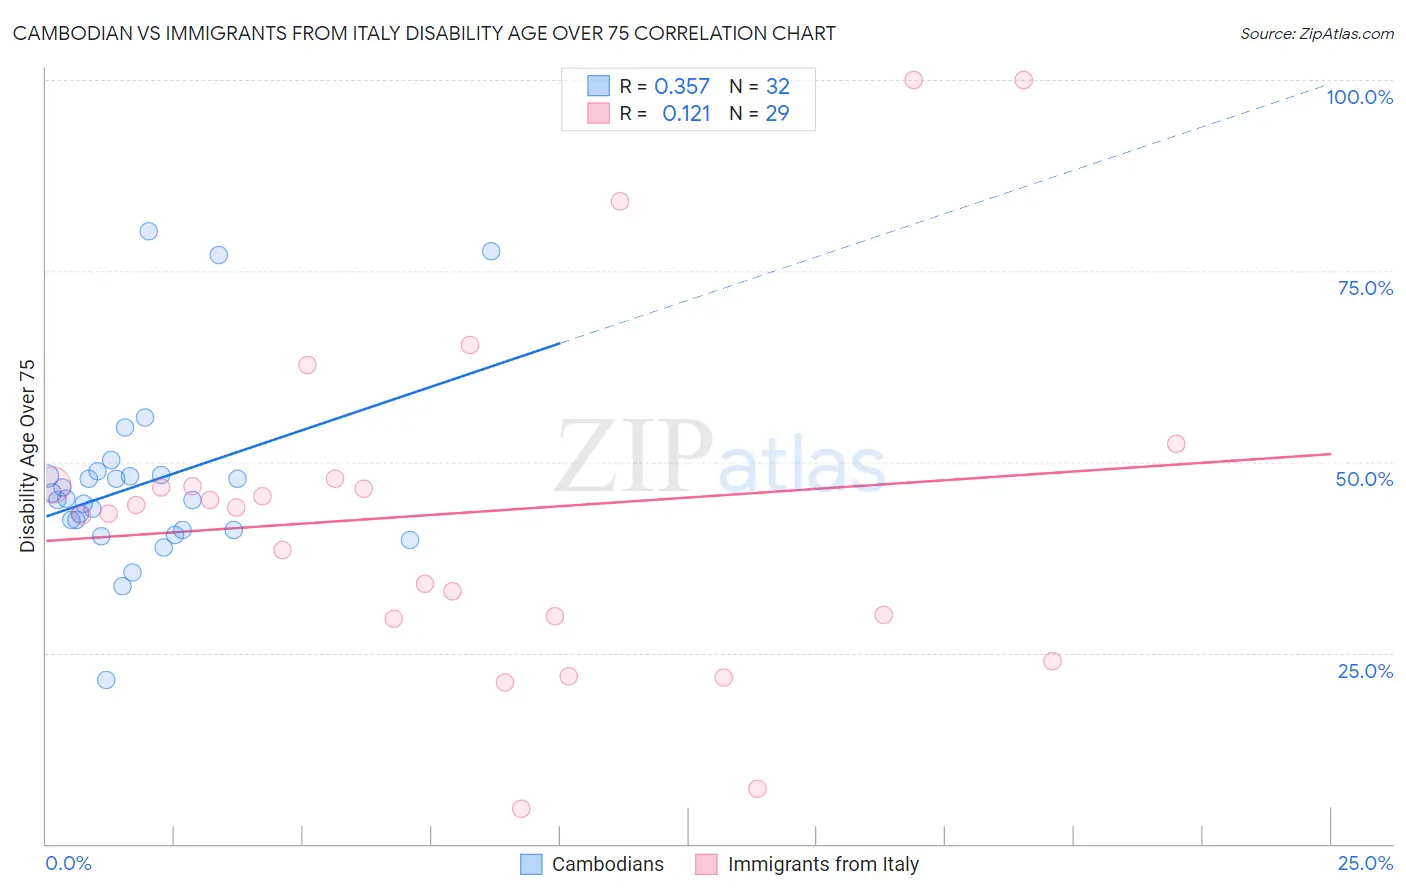
Cambodian vs Immigrants from Italy Disability Age Over 75 Correlation Chart
The statistical analysis conducted on geographies consisting of 102,426,643 people shows a mild positive correlation between the proportion of Cambodians and percentage of population with a disability over the age of 75 in the United States with a correlation coefficient (R) of 0.357 and weighted average of 46.1%. Similarly, the statistical analysis conducted on geographies consisting of 323,975,134 people shows a poor positive correlation between the proportion of Immigrants from Italy and percentage of population with a disability over the age of 75 in the United States with a correlation coefficient (R) of 0.121 and weighted average of 45.8%, a difference of 0.62%.
Disability Age Over 75 Correlation Summary
| Measurement | Cambodian | Immigrants from Italy |
| Minimum | 21.4% | 4.6% |
| Maximum | 80.2% | 100.0% |
| Range | 58.8% | 95.4% |
| Mean | 47.1% | 43.4% |
| Median | 45.1% | 44.0% |
| Interquartile 25% (IQ1) | 41.1% | 29.6% |
| Interquartile 75% (IQ3) | 48.2% | 47.4% |
| Interquartile Range (IQR) | 7.2% | 17.8% |
| Standard Deviation (Sample) | 12.0% | 22.7% |
| Standard Deviation (Population) | 11.8% | 22.3% |
Demographics Similar to Cambodians and Immigrants from Italy by Disability Age Over 75
In terms of disability age over 75, the demographic groups most similar to Cambodians are Immigrants from Hungary (46.1%, a difference of 0.020%), Immigrants from Sri Lanka (46.1%, a difference of 0.050%), Jordanian (46.1%, a difference of 0.080%), Immigrants from Romania (46.0%, a difference of 0.18%), and Immigrants from South Central Asia (46.0%, a difference of 0.24%). Similarly, the demographic groups most similar to Immigrants from Italy are Slovak (45.8%, a difference of 0.080%), Maltese (45.8%, a difference of 0.080%), Immigrants from Netherlands (45.9%, a difference of 0.15%), Immigrants from Turkey (45.9%, a difference of 0.16%), and Immigrants from Israel (45.9%, a difference of 0.16%).
| Demographics | Rating | Rank | Disability Age Over 75 |
| Immigrants | Italy | 99.7 /100 | #53 | Exceptional 45.8% |
| Slovaks | 99.6 /100 | #54 | Exceptional 45.8% |
| Maltese | 99.6 /100 | #55 | Exceptional 45.8% |
| Immigrants | Netherlands | 99.6 /100 | #56 | Exceptional 45.9% |
| Immigrants | Turkey | 99.6 /100 | #57 | Exceptional 45.9% |
| Immigrants | Israel | 99.6 /100 | #58 | Exceptional 45.9% |
| Iranians | 99.6 /100 | #59 | Exceptional 45.9% |
| Immigrants | Europe | 99.6 /100 | #60 | Exceptional 45.9% |
| Immigrants | Argentina | 99.6 /100 | #61 | Exceptional 45.9% |
| Burmese | 99.5 /100 | #62 | Exceptional 45.9% |
| Immigrants | Norway | 99.5 /100 | #63 | Exceptional 45.9% |
| Immigrants | North Macedonia | 99.5 /100 | #64 | Exceptional 45.9% |
| Austrians | 99.5 /100 | #65 | Exceptional 46.0% |
| Immigrants | England | 99.5 /100 | #66 | Exceptional 46.0% |
| Immigrants | Spain | 99.4 /100 | #67 | Exceptional 46.0% |
| Immigrants | South Central Asia | 99.4 /100 | #68 | Exceptional 46.0% |
| Immigrants | Romania | 99.3 /100 | #69 | Exceptional 46.0% |
| Jordanians | 99.2 /100 | #70 | Exceptional 46.1% |
| Immigrants | Sri Lanka | 99.2 /100 | #71 | Exceptional 46.1% |
| Immigrants | Hungary | 99.1 /100 | #72 | Exceptional 46.1% |
| Cambodians | 99.1 /100 | #73 | Exceptional 46.1% |