Hispanic or Latino vs Finnish Single Mother Households
COMPARE
Hispanic or Latino
Finnish
Single Mother Households
Single Mother Households Comparison
Hispanics or Latinos
Finns
7.9%
SINGLE MOTHER HOUSEHOLDS
0.0/ 100
METRIC RATING
297th/ 347
METRIC RANK
5.7%
SINGLE MOTHER HOUSEHOLDS
97.6/ 100
METRIC RATING
86th/ 347
METRIC RANK
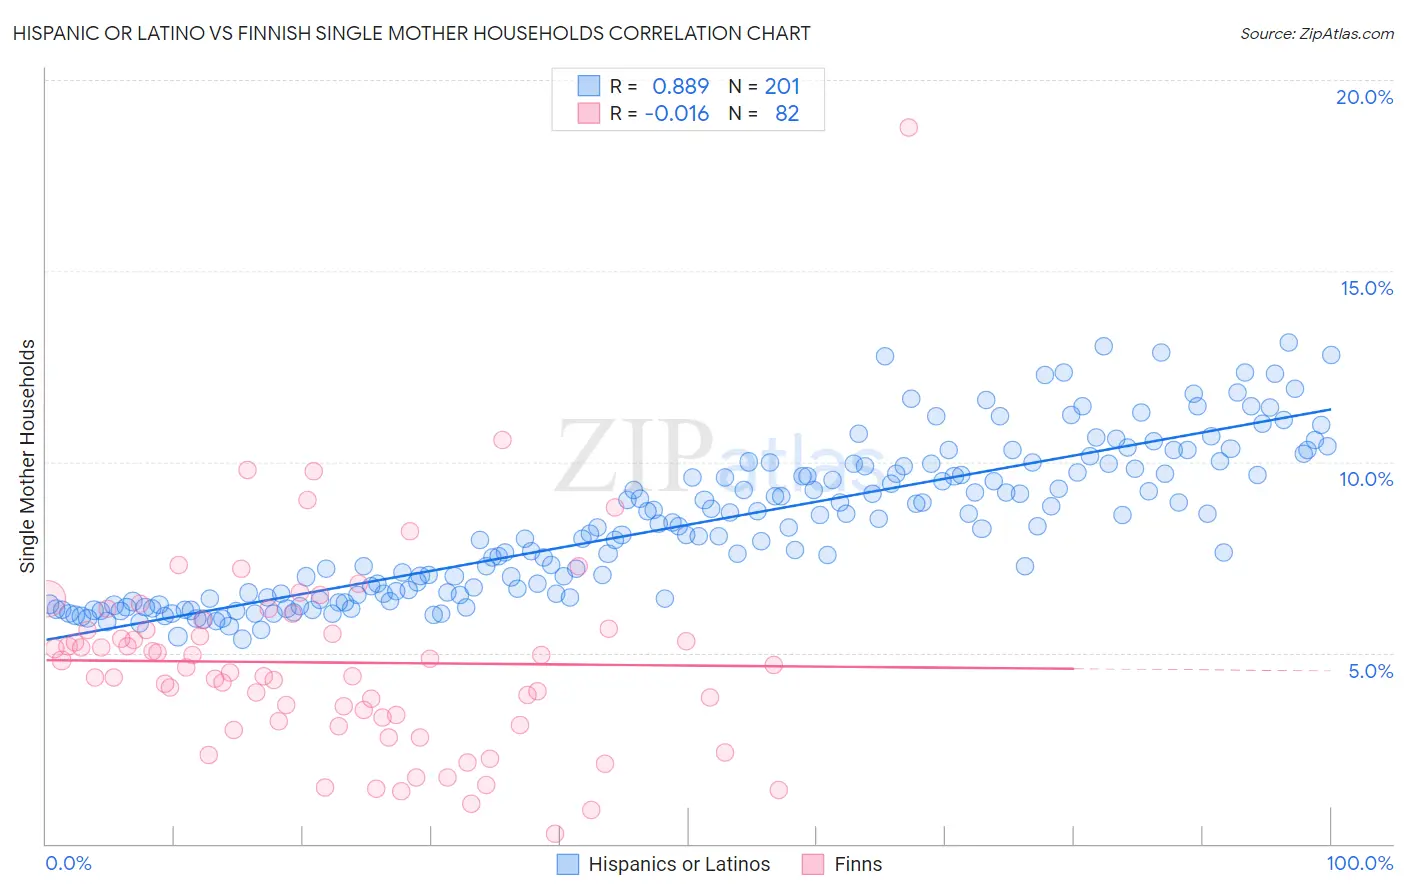
Hispanic or Latino vs Finnish Single Mother Households Correlation Chart
The statistical analysis conducted on geographies consisting of 572,818,601 people shows a very strong positive correlation between the proportion of Hispanics or Latinos and percentage of single mother households in the United States with a correlation coefficient (R) of 0.889 and weighted average of 7.9%. Similarly, the statistical analysis conducted on geographies consisting of 403,107,301 people shows no correlation between the proportion of Finns and percentage of single mother households in the United States with a correlation coefficient (R) of -0.016 and weighted average of 5.7%, a difference of 39.5%.
Single Mother Households Correlation Summary
| Measurement | Hispanic or Latino | Finnish |
| Minimum | 5.4% | 0.26% |
| Maximum | 13.1% | 18.8% |
| Range | 7.8% | 18.5% |
| Mean | 8.4% | 4.7% |
| Median | 8.3% | 4.5% |
| Interquartile 25% (IQ1) | 6.5% | 3.2% |
| Interquartile 75% (IQ3) | 9.8% | 5.6% |
| Interquartile Range (IQR) | 3.4% | 2.4% |
| Standard Deviation (Sample) | 2.0% | 2.6% |
| Standard Deviation (Population) | 2.0% | 2.6% |
Similar Demographics by Single Mother Households
Demographics Similar to Hispanics or Latinos by Single Mother Households
In terms of single mother households, the demographic groups most similar to Hispanics or Latinos are Immigrants from Latin America (7.9%, a difference of 0.040%), Barbadian (7.9%, a difference of 0.10%), Immigrants from West Indies (7.9%, a difference of 0.11%), Houma (7.9%, a difference of 0.19%), and Apache (7.9%, a difference of 0.39%).
| Demographics | Rating | Rank | Single Mother Households |
| Immigrants | Nigeria | 0.0 /100 | #290 | Tragic 7.8% |
| West Indians | 0.0 /100 | #291 | Tragic 7.8% |
| Ghanaians | 0.0 /100 | #292 | Tragic 7.8% |
| Immigrants | Cameroon | 0.0 /100 | #293 | Tragic 7.9% |
| Apache | 0.0 /100 | #294 | Tragic 7.9% |
| Barbadians | 0.0 /100 | #295 | Tragic 7.9% |
| Immigrants | Latin America | 0.0 /100 | #296 | Tragic 7.9% |
| Hispanics or Latinos | 0.0 /100 | #297 | Tragic 7.9% |
| Immigrants | West Indies | 0.0 /100 | #298 | Tragic 7.9% |
| Houma | 0.0 /100 | #299 | Tragic 7.9% |
| Mexicans | 0.0 /100 | #300 | Tragic 8.0% |
| Chippewa | 0.0 /100 | #301 | Tragic 8.0% |
| Immigrants | Ghana | 0.0 /100 | #302 | Tragic 8.0% |
| Immigrants | Bahamas | 0.0 /100 | #303 | Tragic 8.0% |
| Natives/Alaskans | 0.0 /100 | #304 | Tragic 8.0% |
Demographics Similar to Finns by Single Mother Households
In terms of single mother households, the demographic groups most similar to Finns are Hungarian (5.7%, a difference of 0.030%), Immigrants from Turkey (5.7%, a difference of 0.080%), Israeli (5.7%, a difference of 0.15%), Carpatho Rusyn (5.7%, a difference of 0.18%), and Immigrants from Hungary (5.7%, a difference of 0.25%).
| Demographics | Rating | Rank | Single Mother Households |
| Immigrants | Sri Lanka | 98.0 /100 | #79 | Exceptional 5.6% |
| Czechs | 97.9 /100 | #80 | Exceptional 5.6% |
| Immigrants | Moldova | 97.9 /100 | #81 | Exceptional 5.6% |
| Immigrants | Malaysia | 97.8 /100 | #82 | Exceptional 5.7% |
| Immigrants | Hungary | 97.8 /100 | #83 | Exceptional 5.7% |
| Carpatho Rusyns | 97.7 /100 | #84 | Exceptional 5.7% |
| Hungarians | 97.6 /100 | #85 | Exceptional 5.7% |
| Finns | 97.6 /100 | #86 | Exceptional 5.7% |
| Immigrants | Turkey | 97.5 /100 | #87 | Exceptional 5.7% |
| Israelis | 97.4 /100 | #88 | Exceptional 5.7% |
| Ukrainians | 97.2 /100 | #89 | Exceptional 5.7% |
| Immigrants | Indonesia | 97.2 /100 | #90 | Exceptional 5.7% |
| Europeans | 97.0 /100 | #91 | Exceptional 5.7% |
| Immigrants | Western Asia | 96.7 /100 | #92 | Exceptional 5.7% |
| Serbians | 96.7 /100 | #93 | Exceptional 5.7% |