Cajun vs Immigrants from Canada Births to Unmarried Women
COMPARE
Cajun
Immigrants from Canada
Births to Unmarried Women
Births to Unmarried Women Comparison
Cajuns
Immigrants from Canada
41.0%
BIRTHS TO UNMARRIED WOMEN
0.0/ 100
METRIC RATING
322nd/ 347
METRIC RANK
30.4%
BIRTHS TO UNMARRIED WOMEN
83.7/ 100
METRIC RATING
139th/ 347
METRIC RANK
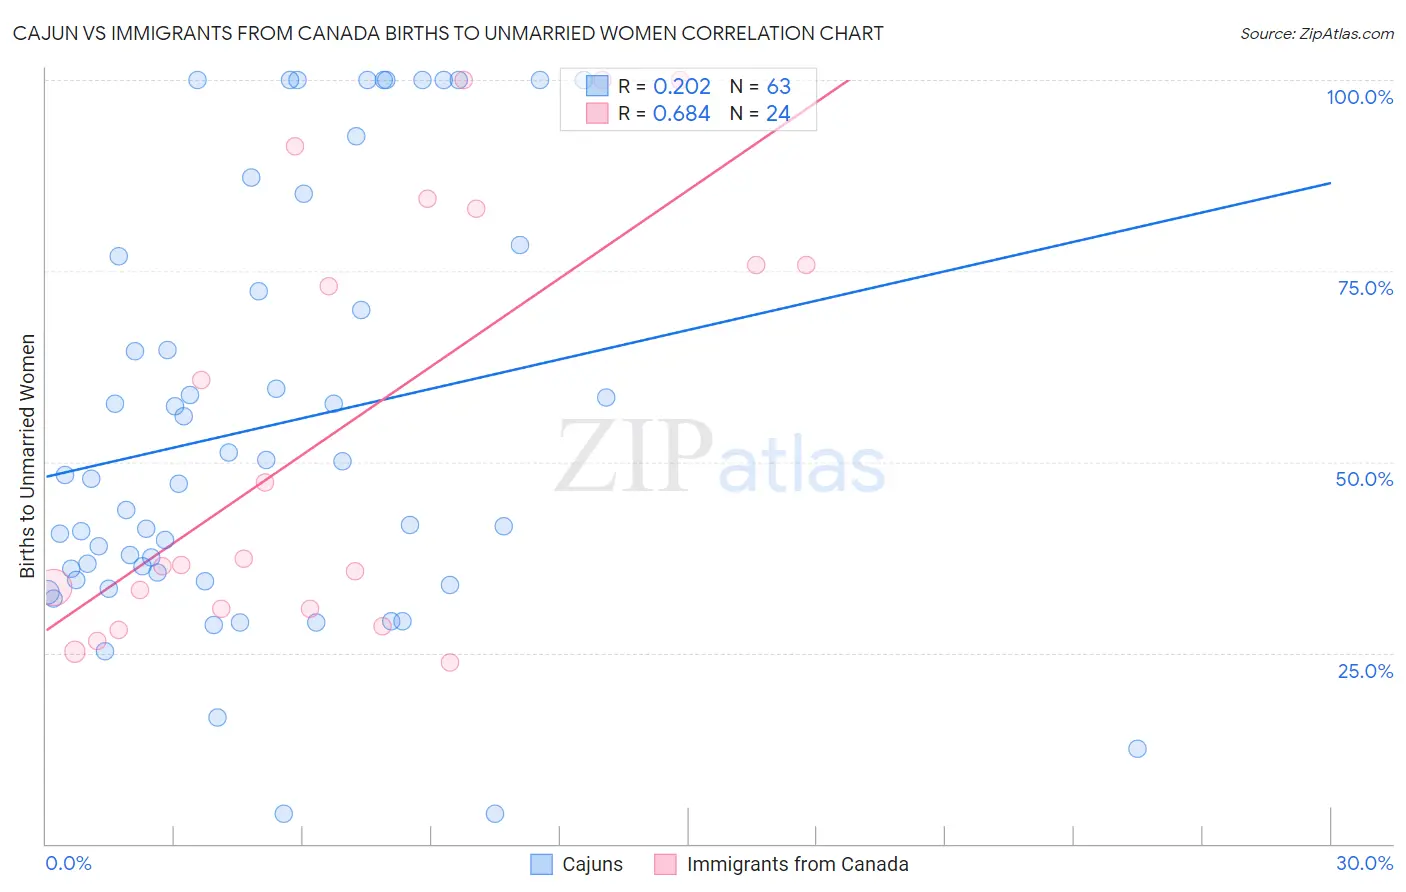
Cajun vs Immigrants from Canada Births to Unmarried Women Correlation Chart
The statistical analysis conducted on geographies consisting of 144,039,196 people shows a weak positive correlation between the proportion of Cajuns and percentage of births to unmarried women in the United States with a correlation coefficient (R) of 0.202 and weighted average of 41.0%. Similarly, the statistical analysis conducted on geographies consisting of 419,760,568 people shows a significant positive correlation between the proportion of Immigrants from Canada and percentage of births to unmarried women in the United States with a correlation coefficient (R) of 0.684 and weighted average of 30.4%, a difference of 34.6%.
Births to Unmarried Women Correlation Summary
| Measurement | Cajun | Immigrants from Canada |
| Minimum | 4.0% | 23.8% |
| Maximum | 100.0% | 100.0% |
| Range | 96.0% | 76.2% |
| Mean | 54.7% | 54.1% |
| Median | 47.8% | 36.9% |
| Interquartile 25% (IQ1) | 34.6% | 30.8% |
| Interquartile 75% (IQ3) | 76.9% | 79.4% |
| Interquartile Range (IQR) | 42.3% | 48.7% |
| Standard Deviation (Sample) | 27.5% | 27.9% |
| Standard Deviation (Population) | 27.2% | 27.3% |
Similar Demographics by Births to Unmarried Women
Demographics Similar to Cajuns by Births to Unmarried Women
In terms of births to unmarried women, the demographic groups most similar to Cajuns are Sioux (41.0%, a difference of 0.070%), Bahamian (40.8%, a difference of 0.49%), Cape Verdean (41.3%, a difference of 0.87%), Cheyenne (41.3%, a difference of 0.93%), and Immigrants from Cuba (41.5%, a difference of 1.2%).
| Demographics | Rating | Rank | Births to Unmarried Women |
| Dominicans | 0.0 /100 | #315 | Tragic 39.8% |
| Apache | 0.0 /100 | #316 | Tragic 39.9% |
| Immigrants | Dominican Republic | 0.0 /100 | #317 | Tragic 40.1% |
| Immigrants | Bahamas | 0.0 /100 | #318 | Tragic 40.1% |
| Yakama | 0.0 /100 | #319 | Tragic 40.3% |
| Crow | 0.0 /100 | #320 | Tragic 40.4% |
| Bahamians | 0.0 /100 | #321 | Tragic 40.8% |
| Cajuns | 0.0 /100 | #322 | Tragic 41.0% |
| Sioux | 0.0 /100 | #323 | Tragic 41.0% |
| Cape Verdeans | 0.0 /100 | #324 | Tragic 41.3% |
| Cheyenne | 0.0 /100 | #325 | Tragic 41.3% |
| Immigrants | Cuba | 0.0 /100 | #326 | Tragic 41.5% |
| Tsimshian | 0.0 /100 | #327 | Tragic 42.2% |
| Immigrants | Cabo Verde | 0.0 /100 | #328 | Tragic 42.2% |
| Paiute | 0.0 /100 | #329 | Tragic 42.5% |
Demographics Similar to Immigrants from Canada by Births to Unmarried Women
In terms of births to unmarried women, the demographic groups most similar to Immigrants from Canada are Puget Sound Salish (30.4%, a difference of 0.030%), Immigrants from Philippines (30.4%, a difference of 0.040%), Swiss (30.5%, a difference of 0.11%), Pakistani (30.5%, a difference of 0.13%), and Immigrants from Scotland (30.4%, a difference of 0.16%).
| Demographics | Rating | Rank | Births to Unmarried Women |
| New Zealanders | 85.5 /100 | #132 | Excellent 30.3% |
| Immigrants | Morocco | 85.2 /100 | #133 | Excellent 30.4% |
| Immigrants | South Eastern Asia | 85.2 /100 | #134 | Excellent 30.4% |
| Brazilians | 84.8 /100 | #135 | Excellent 30.4% |
| Immigrants | Scotland | 84.6 /100 | #136 | Excellent 30.4% |
| Immigrants | Philippines | 83.9 /100 | #137 | Excellent 30.4% |
| Puget Sound Salish | 83.9 /100 | #138 | Excellent 30.4% |
| Immigrants | Canada | 83.7 /100 | #139 | Excellent 30.4% |
| Swiss | 83.1 /100 | #140 | Excellent 30.5% |
| Pakistanis | 83.0 /100 | #141 | Excellent 30.5% |
| South Africans | 82.7 /100 | #142 | Excellent 30.5% |
| Immigrants | Uganda | 82.6 /100 | #143 | Excellent 30.5% |
| Czechs | 82.1 /100 | #144 | Excellent 30.5% |
| Immigrants | North America | 81.5 /100 | #145 | Excellent 30.6% |
| Northern Europeans | 81.4 /100 | #146 | Excellent 30.6% |