Cajun vs Immigrants from Bangladesh Births to Unmarried Women
COMPARE
Cajun
Immigrants from Bangladesh
Births to Unmarried Women
Births to Unmarried Women Comparison
Cajuns
Immigrants from Bangladesh
41.0%
BIRTHS TO UNMARRIED WOMEN
0.0/ 100
METRIC RATING
322nd/ 347
METRIC RANK
30.9%
BIRTHS TO UNMARRIED WOMEN
73.9/ 100
METRIC RATING
155th/ 347
METRIC RANK
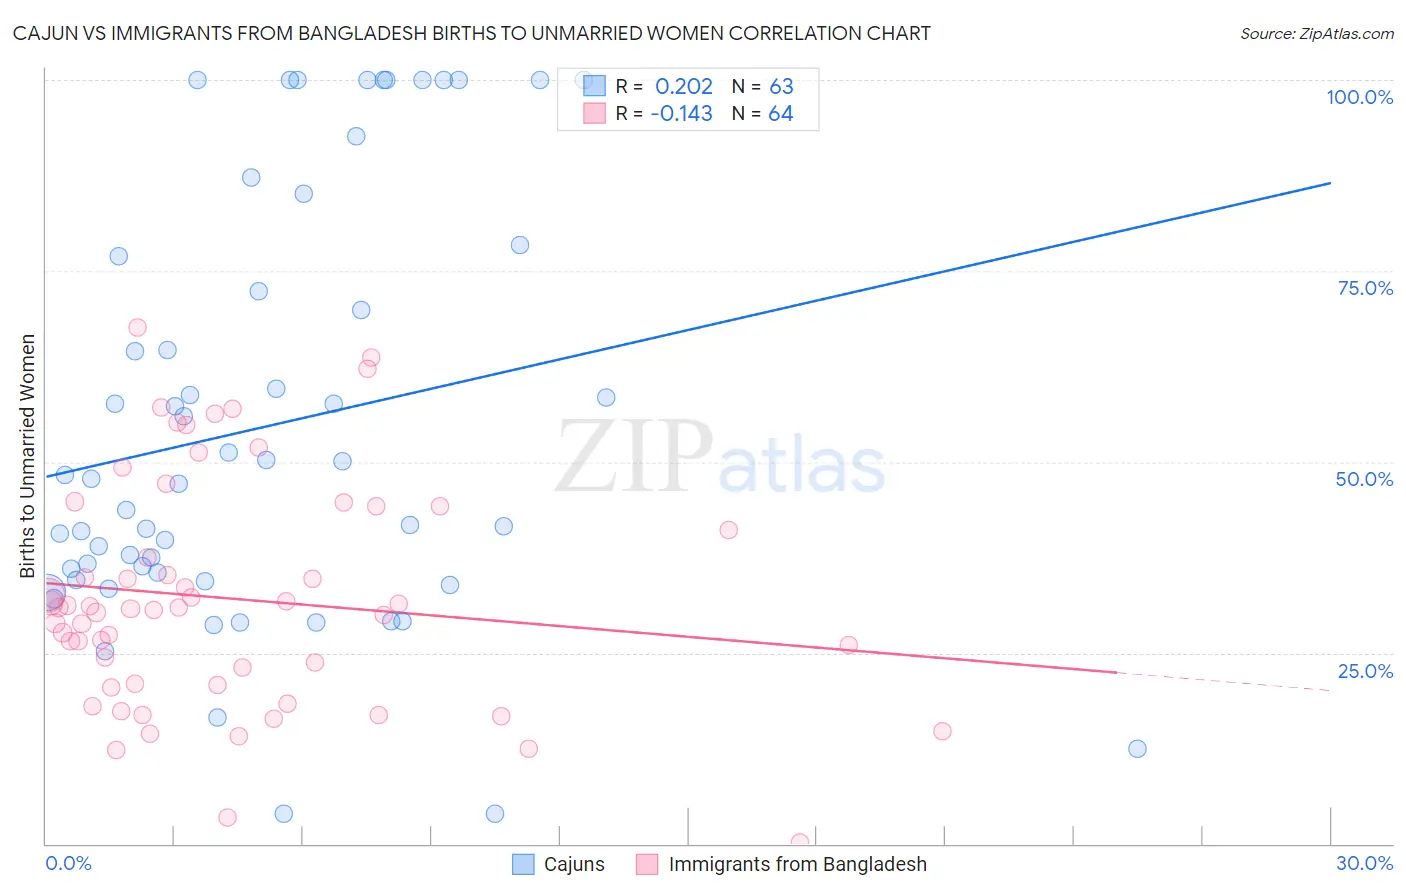
Cajun vs Immigrants from Bangladesh Births to Unmarried Women Correlation Chart
The statistical analysis conducted on geographies consisting of 144,039,196 people shows a weak positive correlation between the proportion of Cajuns and percentage of births to unmarried women in the United States with a correlation coefficient (R) of 0.202 and weighted average of 41.0%. Similarly, the statistical analysis conducted on geographies consisting of 195,686,757 people shows a poor negative correlation between the proportion of Immigrants from Bangladesh and percentage of births to unmarried women in the United States with a correlation coefficient (R) of -0.143 and weighted average of 30.9%, a difference of 32.6%.
Births to Unmarried Women Correlation Summary
| Measurement | Cajun | Immigrants from Bangladesh |
| Minimum | 4.0% | 0.20% |
| Maximum | 100.0% | 67.6% |
| Range | 96.0% | 67.4% |
| Mean | 54.7% | 32.1% |
| Median | 47.8% | 30.8% |
| Interquartile 25% (IQ1) | 34.6% | 20.9% |
| Interquartile 75% (IQ3) | 76.9% | 42.6% |
| Interquartile Range (IQR) | 42.3% | 21.8% |
| Standard Deviation (Sample) | 27.5% | 14.9% |
| Standard Deviation (Population) | 27.2% | 14.8% |
Similar Demographics by Births to Unmarried Women
Demographics Similar to Cajuns by Births to Unmarried Women
In terms of births to unmarried women, the demographic groups most similar to Cajuns are Sioux (41.0%, a difference of 0.070%), Bahamian (40.8%, a difference of 0.49%), Cape Verdean (41.3%, a difference of 0.87%), Cheyenne (41.3%, a difference of 0.93%), and Immigrants from Cuba (41.5%, a difference of 1.2%).
| Demographics | Rating | Rank | Births to Unmarried Women |
| Dominicans | 0.0 /100 | #315 | Tragic 39.8% |
| Apache | 0.0 /100 | #316 | Tragic 39.9% |
| Immigrants | Dominican Republic | 0.0 /100 | #317 | Tragic 40.1% |
| Immigrants | Bahamas | 0.0 /100 | #318 | Tragic 40.1% |
| Yakama | 0.0 /100 | #319 | Tragic 40.3% |
| Crow | 0.0 /100 | #320 | Tragic 40.4% |
| Bahamians | 0.0 /100 | #321 | Tragic 40.8% |
| Cajuns | 0.0 /100 | #322 | Tragic 41.0% |
| Sioux | 0.0 /100 | #323 | Tragic 41.0% |
| Cape Verdeans | 0.0 /100 | #324 | Tragic 41.3% |
| Cheyenne | 0.0 /100 | #325 | Tragic 41.3% |
| Immigrants | Cuba | 0.0 /100 | #326 | Tragic 41.5% |
| Tsimshian | 0.0 /100 | #327 | Tragic 42.2% |
| Immigrants | Cabo Verde | 0.0 /100 | #328 | Tragic 42.2% |
| Paiute | 0.0 /100 | #329 | Tragic 42.5% |
Demographics Similar to Immigrants from Bangladesh by Births to Unmarried Women
In terms of births to unmarried women, the demographic groups most similar to Immigrants from Bangladesh are Carpatho Rusyn (30.9%, a difference of 0.050%), Yugoslavian (30.8%, a difference of 0.15%), Immigrants from Eastern Africa (31.0%, a difference of 0.22%), British (30.8%, a difference of 0.27%), and Polish (30.8%, a difference of 0.29%).
| Demographics | Rating | Rank | Births to Unmarried Women |
| Chileans | 79.1 /100 | #148 | Good 30.7% |
| Serbians | 78.8 /100 | #149 | Good 30.7% |
| Somalis | 77.8 /100 | #150 | Good 30.7% |
| Italians | 77.0 /100 | #151 | Good 30.8% |
| Poles | 76.2 /100 | #152 | Good 30.8% |
| British | 76.0 /100 | #153 | Good 30.8% |
| Yugoslavians | 75.1 /100 | #154 | Good 30.8% |
| Immigrants | Bangladesh | 73.9 /100 | #155 | Good 30.9% |
| Carpatho Rusyns | 73.5 /100 | #156 | Good 30.9% |
| Immigrants | Eastern Africa | 72.1 /100 | #157 | Good 31.0% |
| Austrians | 69.9 /100 | #158 | Good 31.0% |
| Immigrants | England | 69.4 /100 | #159 | Good 31.1% |
| Immigrants | Western Europe | 69.3 /100 | #160 | Good 31.1% |
| Immigrants | Southern Europe | 68.7 /100 | #161 | Good 31.1% |
| Slovenes | 65.9 /100 | #162 | Good 31.2% |