Immigrants from Latvia vs Bangladeshi Single Father Households
COMPARE
Immigrants from Latvia
Bangladeshi
Single Father Households
Single Father Households Comparison
Immigrants from Latvia
Bangladeshis
1.9%
SINGLE FATHER HOUSEHOLDS
100.0/ 100
METRIC RATING
22nd/ 347
METRIC RANK
3.1%
SINGLE FATHER HOUSEHOLDS
0.0/ 100
METRIC RATING
327th/ 347
METRIC RANK
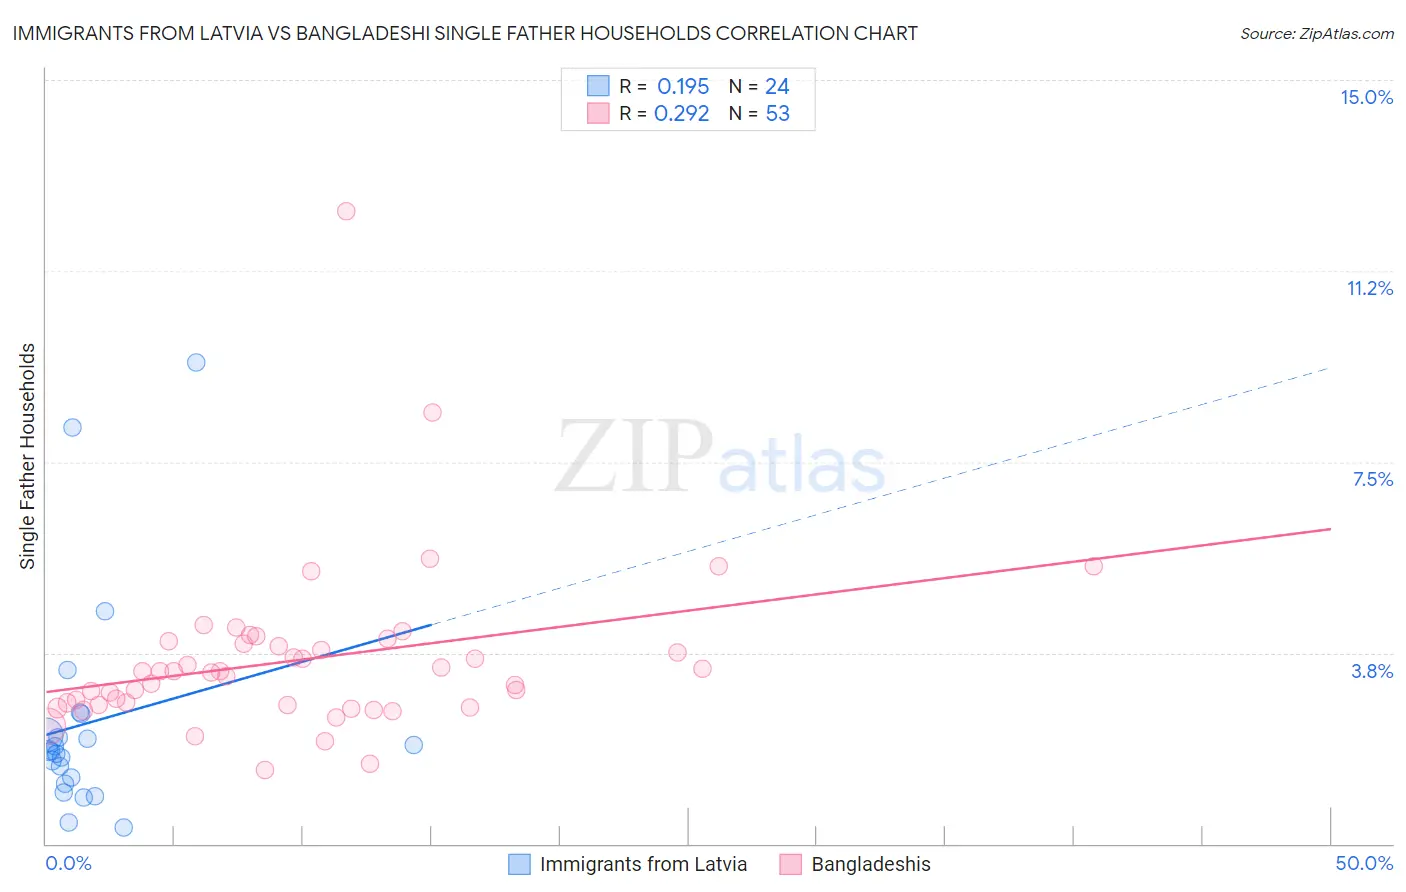
Immigrants from Latvia vs Bangladeshi Single Father Households Correlation Chart
The statistical analysis conducted on geographies consisting of 113,497,933 people shows a poor positive correlation between the proportion of Immigrants from Latvia and percentage of single father households in the United States with a correlation coefficient (R) of 0.195 and weighted average of 1.9%. Similarly, the statistical analysis conducted on geographies consisting of 140,991,030 people shows a weak positive correlation between the proportion of Bangladeshis and percentage of single father households in the United States with a correlation coefficient (R) of 0.292 and weighted average of 3.1%, a difference of 58.9%.
Single Father Households Correlation Summary
| Measurement | Immigrants from Latvia | Bangladeshi |
| Minimum | 0.31% | 1.4% |
| Maximum | 9.5% | 12.4% |
| Range | 9.1% | 11.0% |
| Mean | 2.4% | 3.6% |
| Median | 1.8% | 3.4% |
| Interquartile 25% (IQ1) | 1.2% | 2.7% |
| Interquartile 75% (IQ3) | 2.3% | 3.9% |
| Interquartile Range (IQR) | 1.1% | 1.2% |
| Standard Deviation (Sample) | 2.2% | 1.7% |
| Standard Deviation (Population) | 2.1% | 1.7% |
Similar Demographics by Single Father Households
Demographics Similar to Immigrants from Latvia by Single Father Households
In terms of single father households, the demographic groups most similar to Immigrants from Latvia are Immigrants from Albania (1.9%, a difference of 0.19%), Thai (1.9%, a difference of 0.49%), Iranian (1.9%, a difference of 0.56%), Immigrants from Croatia (2.0%, a difference of 1.2%), and Immigrants from Russia (2.0%, a difference of 1.2%).
| Demographics | Rating | Rank | Single Father Households |
| Immigrants | Eastern Asia | 100.0 /100 | #15 | Exceptional 1.9% |
| Immigrants | Iran | 100.0 /100 | #16 | Exceptional 1.9% |
| Immigrants | India | 100.0 /100 | #17 | Exceptional 1.9% |
| Indians (Asian) | 100.0 /100 | #18 | Exceptional 1.9% |
| Iranians | 100.0 /100 | #19 | Exceptional 1.9% |
| Thais | 100.0 /100 | #20 | Exceptional 1.9% |
| Immigrants | Albania | 100.0 /100 | #21 | Exceptional 1.9% |
| Immigrants | Latvia | 100.0 /100 | #22 | Exceptional 1.9% |
| Immigrants | Croatia | 100.0 /100 | #23 | Exceptional 2.0% |
| Immigrants | Russia | 100.0 /100 | #24 | Exceptional 2.0% |
| Eastern Europeans | 100.0 /100 | #25 | Exceptional 2.0% |
| Assyrians/Chaldeans/Syriacs | 100.0 /100 | #26 | Exceptional 2.0% |
| Immigrants | South Central Asia | 100.0 /100 | #27 | Exceptional 2.0% |
| Immigrants | Japan | 100.0 /100 | #28 | Exceptional 2.0% |
| Bulgarians | 100.0 /100 | #29 | Exceptional 2.0% |
Demographics Similar to Bangladeshis by Single Father Households
In terms of single father households, the demographic groups most similar to Bangladeshis are Immigrants from Cabo Verde (3.1%, a difference of 0.55%), Chippewa (3.1%, a difference of 0.65%), Aleut (3.0%, a difference of 0.88%), Immigrants from Mexico (3.0%, a difference of 1.1%), and Nepalese (3.1%, a difference of 1.5%).
| Demographics | Rating | Rank | Single Father Households |
| Guatemalans | 0.0 /100 | #320 | Tragic 3.0% |
| Mexicans | 0.0 /100 | #321 | Tragic 3.0% |
| Immigrants | Guatemala | 0.0 /100 | #322 | Tragic 3.0% |
| Immigrants | Central America | 0.0 /100 | #323 | Tragic 3.0% |
| Fijians | 0.0 /100 | #324 | Tragic 3.0% |
| Immigrants | Mexico | 0.0 /100 | #325 | Tragic 3.0% |
| Aleuts | 0.0 /100 | #326 | Tragic 3.0% |
| Bangladeshis | 0.0 /100 | #327 | Tragic 3.1% |
| Immigrants | Cabo Verde | 0.0 /100 | #328 | Tragic 3.1% |
| Chippewa | 0.0 /100 | #329 | Tragic 3.1% |
| Nepalese | 0.0 /100 | #330 | Tragic 3.1% |
| Navajo | 0.0 /100 | #331 | Tragic 3.2% |
| Yaqui | 0.0 /100 | #332 | Tragic 3.2% |
| Natives/Alaskans | 0.0 /100 | #333 | Tragic 3.2% |
| Yuman | 0.0 /100 | #334 | Tragic 3.3% |