Cajun vs Bangladeshi Disability Age 18 to 34
COMPARE
Cajun
Bangladeshi
Disability Age 18 to 34
Disability Age 18 to 34 Comparison
Cajuns
Bangladeshis
8.2%
DISABILITY AGE 18 TO 34
0.0/ 100
METRIC RATING
324th/ 347
METRIC RANK
7.4%
DISABILITY AGE 18 TO 34
0.1/ 100
METRIC RATING
267th/ 347
METRIC RANK
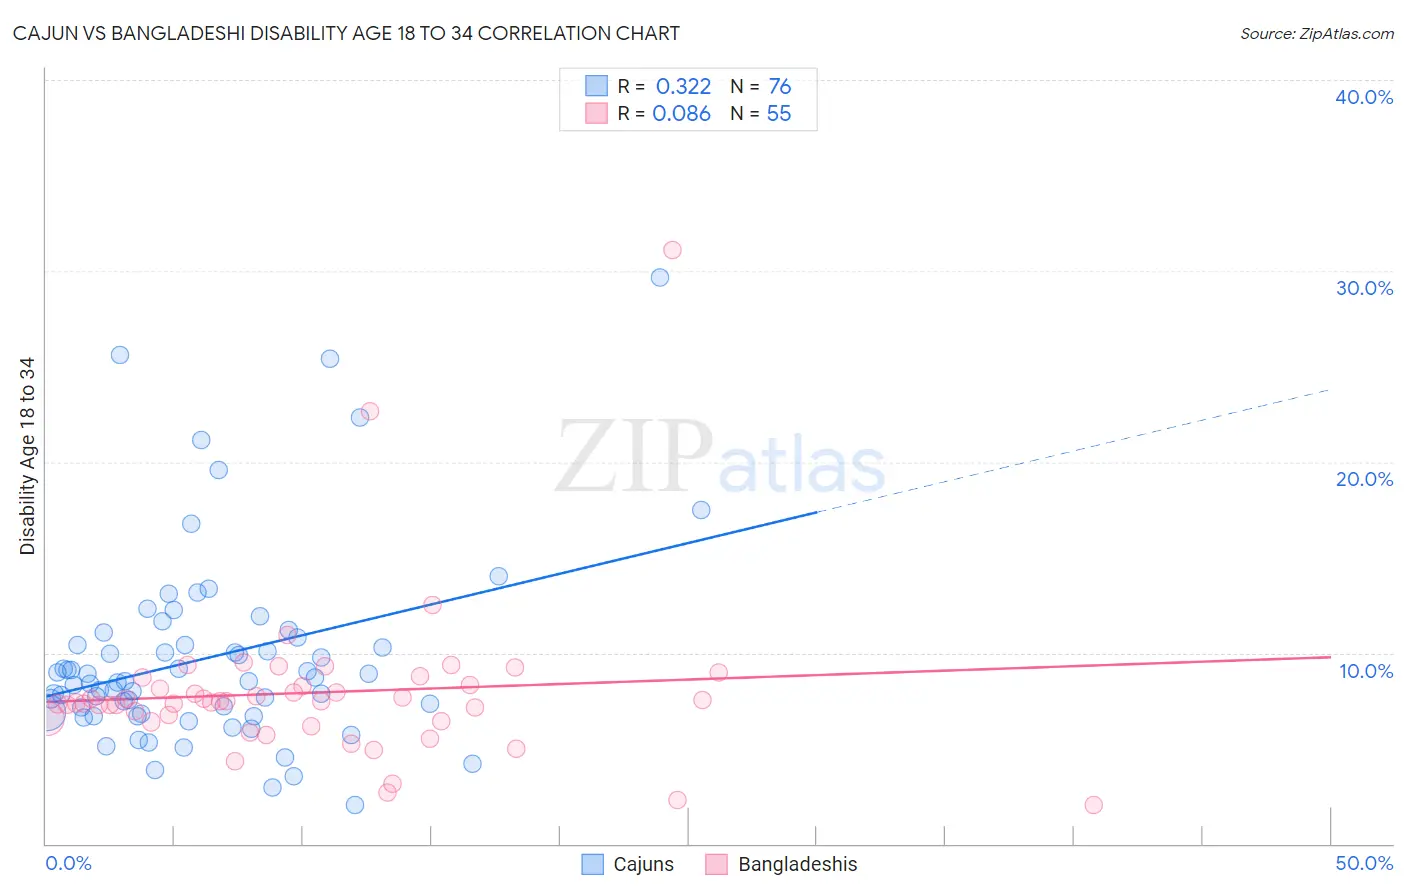
Cajun vs Bangladeshi Disability Age 18 to 34 Correlation Chart
The statistical analysis conducted on geographies consisting of 149,523,864 people shows a mild positive correlation between the proportion of Cajuns and percentage of population with a disability between the ages 18 and 35 in the United States with a correlation coefficient (R) of 0.322 and weighted average of 8.2%. Similarly, the statistical analysis conducted on geographies consisting of 141,298,809 people shows a slight positive correlation between the proportion of Bangladeshis and percentage of population with a disability between the ages 18 and 35 in the United States with a correlation coefficient (R) of 0.086 and weighted average of 7.4%, a difference of 11.0%.
Disability Age 18 to 34 Correlation Summary
| Measurement | Cajun | Bangladeshi |
| Minimum | 2.0% | 2.0% |
| Maximum | 29.6% | 31.1% |
| Range | 27.6% | 29.1% |
| Mean | 9.7% | 7.9% |
| Median | 8.5% | 7.5% |
| Interquartile 25% (IQ1) | 6.8% | 6.4% |
| Interquartile 75% (IQ3) | 10.6% | 8.3% |
| Interquartile Range (IQR) | 3.8% | 1.9% |
| Standard Deviation (Sample) | 5.1% | 4.3% |
| Standard Deviation (Population) | 5.1% | 4.2% |
Similar Demographics by Disability Age 18 to 34
Demographics Similar to Cajuns by Disability Age 18 to 34
In terms of disability age 18 to 34, the demographic groups most similar to Cajuns are French American Indian (8.2%, a difference of 0.040%), Native/Alaskan (8.2%, a difference of 0.52%), Potawatomi (8.2%, a difference of 0.54%), Cree (8.1%, a difference of 0.55%), and Blackfeet (8.1%, a difference of 0.61%).
| Demographics | Rating | Rank | Disability Age 18 to 34 |
| Hmong | 0.0 /100 | #317 | Tragic 8.1% |
| French Canadians | 0.0 /100 | #318 | Tragic 8.1% |
| Aleuts | 0.0 /100 | #319 | Tragic 8.1% |
| Navajo | 0.0 /100 | #320 | Tragic 8.1% |
| Blackfeet | 0.0 /100 | #321 | Tragic 8.1% |
| Cree | 0.0 /100 | #322 | Tragic 8.1% |
| French American Indians | 0.0 /100 | #323 | Tragic 8.2% |
| Cajuns | 0.0 /100 | #324 | Tragic 8.2% |
| Natives/Alaskans | 0.0 /100 | #325 | Tragic 8.2% |
| Potawatomi | 0.0 /100 | #326 | Tragic 8.2% |
| Sioux | 0.0 /100 | #327 | Tragic 8.2% |
| Delaware | 0.0 /100 | #328 | Tragic 8.2% |
| Crow | 0.0 /100 | #329 | Tragic 8.3% |
| Osage | 0.0 /100 | #330 | Tragic 8.3% |
| Comanche | 0.0 /100 | #331 | Tragic 8.3% |
Demographics Similar to Bangladeshis by Disability Age 18 to 34
In terms of disability age 18 to 34, the demographic groups most similar to Bangladeshis are German Russian (7.4%, a difference of 0.060%), Portuguese (7.4%, a difference of 0.080%), Basque (7.4%, a difference of 0.11%), Belgian (7.4%, a difference of 0.21%), and Slovene (7.3%, a difference of 0.23%).
| Demographics | Rating | Rank | Disability Age 18 to 34 |
| Tohono O'odham | 0.2 /100 | #260 | Tragic 7.3% |
| Northern Europeans | 0.2 /100 | #261 | Tragic 7.3% |
| Canadians | 0.2 /100 | #262 | Tragic 7.3% |
| British | 0.2 /100 | #263 | Tragic 7.3% |
| Bermudans | 0.1 /100 | #264 | Tragic 7.3% |
| Slovenes | 0.1 /100 | #265 | Tragic 7.3% |
| German Russians | 0.1 /100 | #266 | Tragic 7.4% |
| Bangladeshis | 0.1 /100 | #267 | Tragic 7.4% |
| Portuguese | 0.1 /100 | #268 | Tragic 7.4% |
| Basques | 0.1 /100 | #269 | Tragic 7.4% |
| Belgians | 0.1 /100 | #270 | Tragic 7.4% |
| Swiss | 0.1 /100 | #271 | Tragic 7.4% |
| Tsimshian | 0.1 /100 | #272 | Tragic 7.4% |
| Slavs | 0.1 /100 | #273 | Tragic 7.4% |
| Africans | 0.1 /100 | #274 | Tragic 7.4% |