Burmese vs Vietnamese In Labor Force | Age 45-54

COMPARE

Burmese
Race
Ancestry
AfghanAfricanAlaska NativeAlaskan AthabascanAlbanianAleutAlsatianAmericanApacheArabArapahoArgentineanArmenianAssyrian/Chaldean/SyriacAustralianAustrianBahamianBangladeshiBarbadianBasqueBelgianBelizeanBermudanBhutaneseBlackfeetBolivianBrazilianBritishBritish West IndianBulgarianBurmeseCajunCambodianCanadianCape VerdeanCarpatho RusynCelticCentral AmericanCentral American IndianCherokeeCheyenneChickasawChileanChineseChippewaChoctawColombianColvilleComancheCosta RicanCreeCreekCroatianCrowCubanCypriotCzechCzechoslovakianDanishDelawareDominicanDutchDutch West IndianEastern EuropeanEcuadorianEgyptianEnglishEstonianEthiopianEuropeanFijianFilipinoFinnishFrenchFrench American IndianFrench CanadianGermanGerman RussianGhanaianGreekGuamanian/ChamorroGuatemalanGuyaneseHaitianHmongHonduranHopiHoumaHungarianIcelanderIndian (Asian)IndonesianInupiatIranianIraqiIrishIroquoisIsraeliItalianJamaicanJapaneseJordanianKenyanKiowaKoreanLaotianLatvianLebaneseLiberianLithuanianLumbeeLuxembourgerMacedonianMalaysianMalteseMarshalleseMenomineeMexicanMexican American IndianMongolianMoroccanNative HawaiianNavajoNepaleseNew ZealanderNicaraguanNigerianNorthern EuropeanNorwegianOkinawanOsageOttawaPaiutePakistaniPalestinianPanamanianParaguayanPennsylvania GermanPeruvianPimaPolishPortuguesePotawatomiPuebloPuerto RicanPuget Sound SalishRomanianRussianSalvadoranSamoanScandinavianScotch-IrishScottishSeminoleSenegaleseSerbianShoshoneSierra LeoneanSiouxSlavicSlovakSloveneSomaliSouth AfricanSouth AmericanSouth American IndianSoviet UnionSpaniardSpanishSpanish AmericanSpanish American IndianSri LankanSubsaharan AfricanSudaneseSwedishSwissSyrianTaiwaneseThaiTlingit-HaidaTohono O'OdhamTonganTrinidadian and TobagonianTsimshianTurkishU.S. Virgin IslanderUgandanUkrainianUruguayanUteVenezuelanWelshWest IndianYakamaYaquiYugoslavianYumanYup'ikZimbabwean
Immigration
NonimmigrantsImmigrantsAfghanistanAfricaAlbaniaArgentinaArmeniaAsiaAustraliaAustriaBahamasBangladeshBarbadosBelarusBelgiumBelizeBoliviaBosnia and HerzegovinaBrazilBulgariaBurma/MyanmarCabo VerdeCambodiaCameroonCanadaCaribbeanCentral AmericaChileChinaColombiaCongoCosta RicaCroatiaCubaCzechoslovakiaDenmarkDominicaDominican RepublicEastern AfricaEastern AsiaEastern EuropeEcuadorEgyptEl SalvadorEnglandEritreaEthiopiaEuropeFijiFranceGermanyGhanaGreeceGrenadaGuatemalaGuyanaHaitiHondurasHong KongHungaryIndiaIndonesiaIranIraqIrelandIsraelItalyJamaicaJapanJordanKazakhstanKenyaKoreaKuwaitLaosLatin AmericaLatviaLebanonLiberiaLithuaniaMalaysiaMexicoMicronesiaMiddle AfricaMoldovaMoroccoNepalNetherlandsNicaraguaNigeriaNorth AmericaNorth MacedoniaNorthern AfricaNorthern EuropeNorwayOceaniaPakistanPanamaPeruPhilippinesPolandPortugalRomaniaRussiaSaudi ArabiaScotlandSenegalSerbiaSierra LeoneSingaporeSomaliaSouth AfricaSouth AmericaSouth Central AsiaSouth Eastern AsiaSouthern EuropeSpainSri LankaSt. Vincent and the GrenadinesSudanSwedenSwitzerlandSyriaTaiwanThailandTrinidad and TobagoTurkeyUgandaUkraineUruguayUzbekistanVenezuelaVietnamWest IndiesWestern AfricaWestern AsiaWestern EuropeYemenZaireZimbabweAzores
Vietnamese
Race
Ancestry
AfghanAfricanAlaska NativeAlaskan AthabascanAlbanianAleutAlsatianAmericanApacheArabArapahoArgentineanArmenianAssyrian/Chaldean/SyriacAustralianAustrianBahamianBangladeshiBarbadianBasqueBelgianBelizeanBermudanBhutaneseBlackfeetBolivianBrazilianBritishBritish West IndianBulgarianCajunCambodianCanadianCape VerdeanCarpatho RusynCelticCentral AmericanCentral American IndianCherokeeCheyenneChickasawChileanChineseChippewaChoctawColombianColvilleComancheCosta RicanCreeCreekCroatianCrowCubanCypriotCzechCzechoslovakianDanishDelawareDominicanDutchDutch West IndianEastern EuropeanEcuadorianEgyptianEnglishEstonianEthiopianEuropeanFijianFilipinoFinnishFrenchFrench American IndianFrench CanadianGermanGerman RussianGhanaianGreekGuamanian/ChamorroGuatemalanGuyaneseHaitianHmongHonduranHopiHoumaHungarianIcelanderIndian (Asian)IndonesianInupiatIranianIraqiIrishIroquoisIsraeliItalianJamaicanJapaneseJordanianKenyanKiowaKoreanLaotianLatvianLebaneseLiberianLithuanianLumbeeLuxembourgerMacedonianMalaysianMalteseMarshalleseMenomineeMexicanMexican American IndianMongolianMoroccanNative HawaiianNavajoNepaleseNew ZealanderNicaraguanNigerianNorthern EuropeanNorwegianOkinawanOsageOttawaPaiutePakistaniPalestinianPanamanianParaguayanPennsylvania GermanPeruvianPimaPolishPortuguesePotawatomiPuebloPuerto RicanPuget Sound SalishRomanianRussianSalvadoranSamoanScandinavianScotch-IrishScottishSeminoleSenegaleseSerbianShoshoneSierra LeoneanSiouxSlavicSlovakSloveneSomaliSouth AfricanSouth AmericanSouth American IndianSoviet UnionSpaniardSpanishSpanish AmericanSpanish American IndianSri LankanSubsaharan AfricanSudaneseSwedishSwissSyrianTaiwaneseThaiTlingit-HaidaTohono O'OdhamTonganTrinidadian and TobagonianTsimshianTurkishU.S. Virgin IslanderUgandanUkrainianUruguayanUteVenezuelanVietnameseWelshWest IndianYakamaYaquiYugoslavianYumanYup'ikZimbabwean
Immigration
NonimmigrantsImmigrantsAfghanistanAfricaAlbaniaArgentinaArmeniaAsiaAustraliaAustriaBahamasBangladeshBarbadosBelarusBelgiumBelizeBoliviaBosnia and HerzegovinaBrazilBulgariaBurma/MyanmarCabo VerdeCambodiaCameroonCanadaCaribbeanCentral AmericaChileChinaColombiaCongoCosta RicaCroatiaCubaCzechoslovakiaDenmarkDominicaDominican RepublicEastern AfricaEastern AsiaEastern EuropeEcuadorEgyptEl SalvadorEnglandEritreaEthiopiaEuropeFijiFranceGermanyGhanaGreeceGrenadaGuatemalaGuyanaHaitiHondurasHong KongHungaryIndiaIndonesiaIranIraqIrelandIsraelItalyJamaicaJapanJordanKazakhstanKenyaKoreaKuwaitLaosLatin AmericaLatviaLebanonLiberiaLithuaniaMalaysiaMexicoMicronesiaMiddle AfricaMoldovaMoroccoNepalNetherlandsNicaraguaNigeriaNorth AmericaNorth MacedoniaNorthern AfricaNorthern EuropeNorwayOceaniaPakistanPanamaPeruPhilippinesPolandPortugalRomaniaRussiaSaudi ArabiaScotlandSenegalSerbiaSierra LeoneSingaporeSomaliaSouth AfricaSouth AmericaSouth Central AsiaSouth Eastern AsiaSouthern EuropeSpainSri LankaSt. Vincent and the GrenadinesSudanSwedenSwitzerlandSyriaTaiwanThailandTrinidad and TobagoTurkeyUgandaUkraineUruguayUzbekistanVenezuelaVietnamWest IndiesWestern AfricaWestern AsiaWestern EuropeYemenZaireZimbabweAzores
In Labor Force | Age 45-54
Income
Poverty
Unemployment
Labor Participation
Family Structure
Vehicle Availability
Education Level
Disability

In Labor Force | Age 45-54 Comparison

Burmese

Vietnamese

Exceptional
Tragic
83.6%
IN LABOR FORCE | AGE 45-54
99.1/ 100
METRIC RATING
44th/ 347
METRIC RANK
80.8%
IN LABOR FORCE | AGE 45-54
0.0/ 100
METRIC RATING
287th/ 347
METRIC RANK

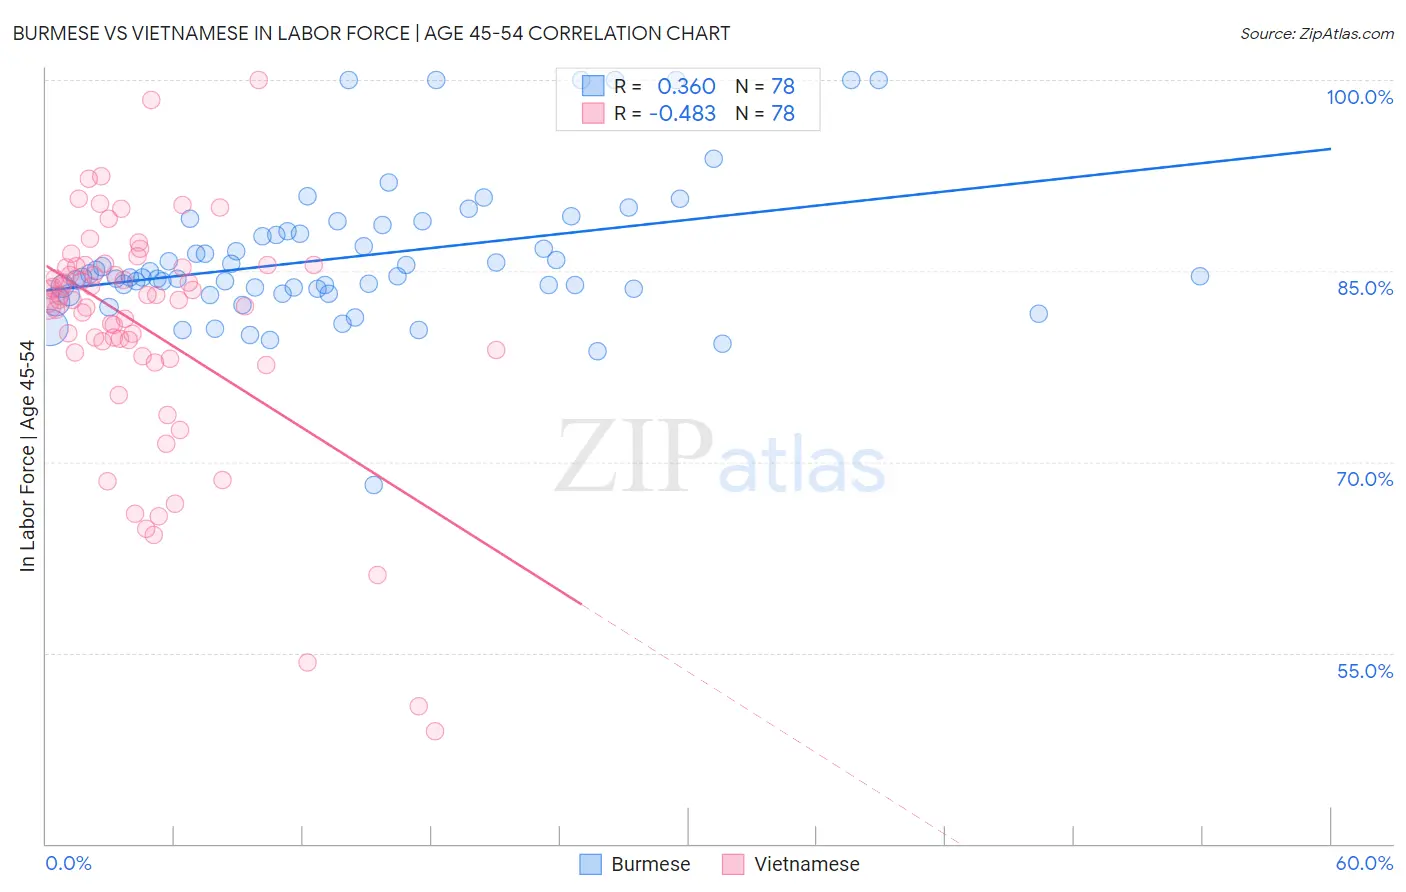
Burmese vs Vietnamese In Labor Force | Age 45-54 Correlation Chart

The statistical analysis conducted on geographies consisting of 464,867,064 people shows a mild positive correlation between the proportion of Burmese and labor force participation rate among population between the ages 45 and 54 in the United States with a correlation coefficient (R) of 0.360 and weighted average of 83.6%. Similarly, the statistical analysis conducted on geographies consisting of 170,653,074 people shows a moderate negative correlation between the proportion of Vietnamese and labor force participation rate among population between the ages 45 and 54 in the United States with a correlation coefficient (R) of -0.483 and weighted average of 80.8%, a difference of 3.5%.
Burmese vs Vietnamese In Labor Force | Age 45-54

In Labor Force | Age 45-54 Correlation Summary

MeasurementBurmeseVietnamese
Minimum68.2%48.8%
Maximum100.0%100.0%
Range31.8%51.2%
Mean86.1%80.5%
Median84.5%82.7%
Interquartile 25% (IQ1)83.6%78.6%
Interquartile 75% (IQ3)88.1%85.3%
Interquartile Range (IQR)4.5%6.8%
Standard Deviation (Sample)5.7%9.4%
Standard Deviation (Population)5.6%9.3%

Similar Demographics by In Labor Force | Age 45-54

Demographics Similar to Burmese by In Labor Force | Age 45-54

In terms of in labor force | age 45-54, the demographic groups most similar to Burmese are Immigrants from Hong Kong (83.6%, a difference of 0.0%), Lithuanian (83.6%, a difference of 0.010%), Venezuelan (83.6%, a difference of 0.020%), Croatian (83.6%, a difference of 0.030%), and Immigrants from Poland (83.6%, a difference of 0.030%).
DemographicsRating | RankIn Labor Force | Age 45-54
Swedes
99.4
/100
|
#37
Exceptional
83.7%
Immigrants | Venezuela
99.4
/100
|
#38
Exceptional
83.7%
Immigrants | Cuba
99.4
/100
|
#39
Exceptional
83.7%
Immigrants | Uganda
99.4
/100
|
#40
Exceptional
83.7%
Immigrants | Korea
99.3
/100
|
#41
Exceptional
83.7%
Immigrants | Moldova
99.3
/100
|
#42
Exceptional
83.7%
Venezuelans
99.2
/100
|
#43
Exceptional
83.6%
Burmese
99.1
/100
|
#44
Exceptional
83.6%
Immigrants | Hong Kong
99.1
/100
|
#45
Exceptional
83.6%
Lithuanians
99.1
/100
|
#46
Exceptional
83.6%
Croatians
99.0
/100
|
#47
Exceptional
83.6%
Immigrants | Poland
99.0
/100
|
#48
Exceptional
83.6%
Immigrants | Morocco
99.0
/100
|
#49
Exceptional
83.6%
Immigrants | Greece
98.8
/100
|
#50
Exceptional
83.6%
Immigrants | Turkey
98.8
/100
|
#51
Exceptional
83.6%

Demographics Similar to Vietnamese by In Labor Force | Age 45-54

In terms of in labor force | age 45-54, the demographic groups most similar to Vietnamese are Immigrants from Dominica (80.8%, a difference of 0.0%), Cree (80.8%, a difference of 0.0%), Delaware (80.8%, a difference of 0.010%), Belizean (80.8%, a difference of 0.020%), and Immigrants from Bangladesh (80.7%, a difference of 0.030%).
DemographicsRating | RankIn Labor Force | Age 45-54
Immigrants | Latin America
0.0
/100
|
#280
Tragic
81.0%
Immigrants | Grenada
0.0
/100
|
#281
Tragic
81.0%
Aleuts
0.0
/100
|
#282
Tragic
81.0%
French American Indians
0.0
/100
|
#283
Tragic
80.8%
Belizeans
0.0
/100
|
#284
Tragic
80.8%
Delaware
0.0
/100
|
#285
Tragic
80.8%
Immigrants | Dominica
0.0
/100
|
#286
Tragic
80.8%
Vietnamese
0.0
/100
|
#287
Tragic
80.8%
Cree
0.0
/100
|
#288
Tragic
80.8%
Immigrants | Bangladesh
0.0
/100
|
#289
Tragic
80.7%
Mexican American Indians
0.0
/100
|
#290
Tragic
80.7%
Immigrants | Belize
0.0
/100
|
#291
Tragic
80.6%
Iroquois
0.0
/100
|
#292
Tragic
80.6%
Osage
0.0
/100
|
#293
Tragic
80.6%
Yakama
0.0
/100
|
#294
Tragic
80.6%