Bulgarian vs Salvadoran Currently Married
COMPARE
Bulgarian
Salvadoran
Currently Married
Currently Married Comparison
Bulgarians
Salvadorans
49.1%
CURRENTLY MARRIED
99.7/ 100
METRIC RATING
22nd/ 347
METRIC RANK
43.5%
CURRENTLY MARRIED
0.1/ 100
METRIC RATING
270th/ 347
METRIC RANK
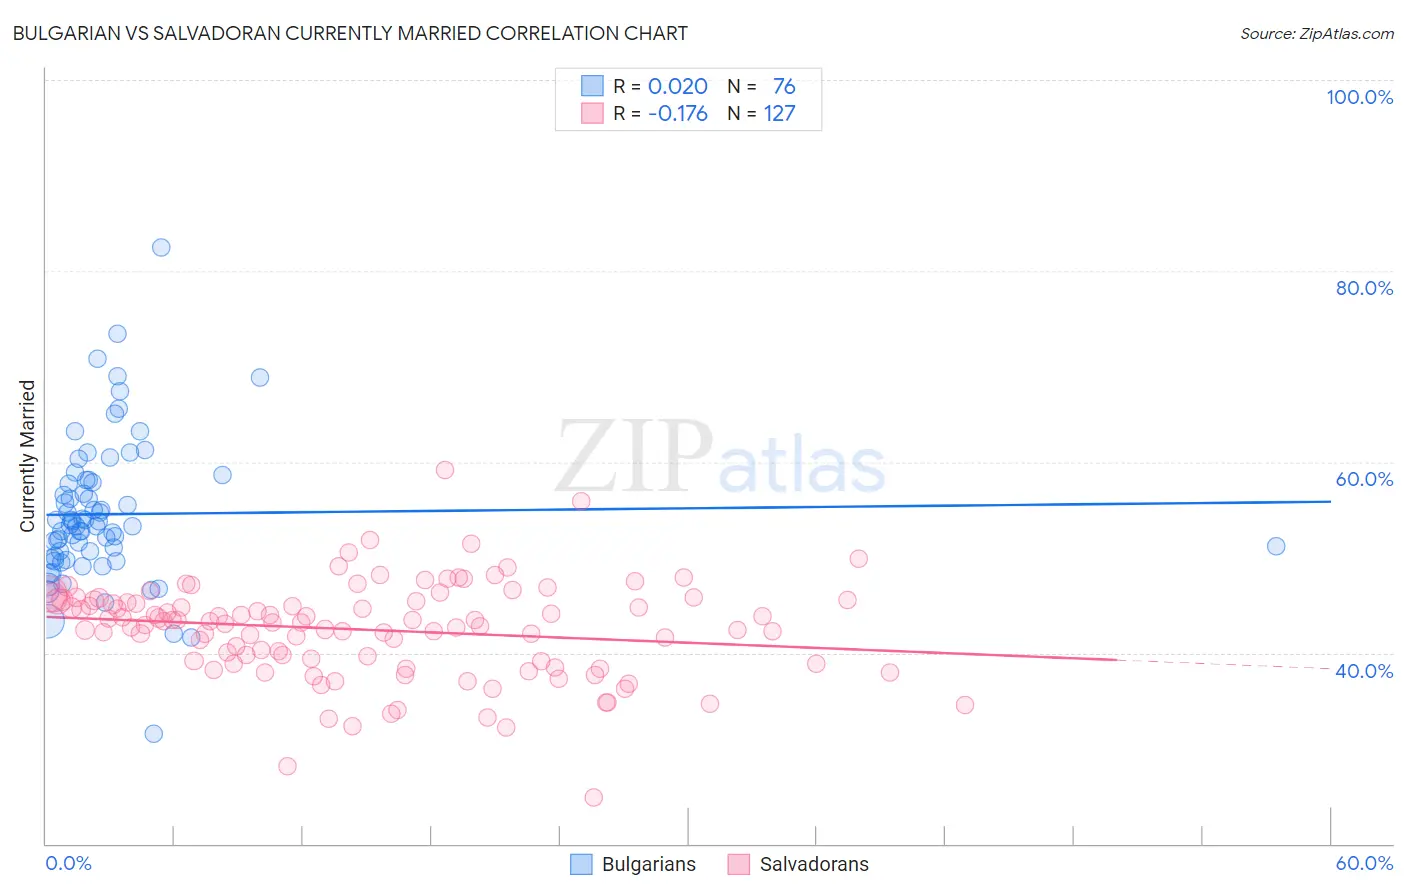
Bulgarian vs Salvadoran Currently Married Correlation Chart
The statistical analysis conducted on geographies consisting of 205,615,003 people shows no correlation between the proportion of Bulgarians and percentage of population currently married in the United States with a correlation coefficient (R) of 0.020 and weighted average of 49.1%. Similarly, the statistical analysis conducted on geographies consisting of 399,003,710 people shows a poor negative correlation between the proportion of Salvadorans and percentage of population currently married in the United States with a correlation coefficient (R) of -0.176 and weighted average of 43.5%, a difference of 12.9%.
Currently Married Correlation Summary
| Measurement | Bulgarian | Salvadoran |
| Minimum | 31.5% | 24.9% |
| Maximum | 82.5% | 59.1% |
| Range | 51.0% | 34.2% |
| Mean | 54.5% | 42.4% |
| Median | 53.3% | 43.2% |
| Interquartile 25% (IQ1) | 49.9% | 39.1% |
| Interquartile 75% (IQ3) | 58.0% | 45.5% |
| Interquartile Range (IQR) | 8.1% | 6.4% |
| Standard Deviation (Sample) | 7.7% | 5.1% |
| Standard Deviation (Population) | 7.6% | 5.0% |
Similar Demographics by Currently Married
Demographics Similar to Bulgarians by Currently Married
In terms of currently married, the demographic groups most similar to Bulgarians are Immigrants from Pakistan (49.1%, a difference of 0.11%), Scottish (49.2%, a difference of 0.22%), Lithuanian (49.0%, a difference of 0.22%), Maltese (49.0%, a difference of 0.23%), and Immigrants from Korea (49.0%, a difference of 0.28%).
| Demographics | Rating | Rank | Currently Married |
| Pennsylvania Germans | 99.9 /100 | #15 | Exceptional 49.6% |
| Chinese | 99.9 /100 | #16 | Exceptional 49.5% |
| Scandinavians | 99.9 /100 | #17 | Exceptional 49.5% |
| Immigrants | Scotland | 99.8 /100 | #18 | Exceptional 49.3% |
| Europeans | 99.8 /100 | #19 | Exceptional 49.3% |
| Luxembourgers | 99.8 /100 | #20 | Exceptional 49.3% |
| Scottish | 99.8 /100 | #21 | Exceptional 49.2% |
| Bulgarians | 99.7 /100 | #22 | Exceptional 49.1% |
| Immigrants | Pakistan | 99.7 /100 | #23 | Exceptional 49.1% |
| Lithuanians | 99.6 /100 | #24 | Exceptional 49.0% |
| Maltese | 99.6 /100 | #25 | Exceptional 49.0% |
| Immigrants | Korea | 99.6 /100 | #26 | Exceptional 49.0% |
| Burmese | 99.6 /100 | #27 | Exceptional 48.9% |
| Welsh | 99.5 /100 | #28 | Exceptional 48.9% |
| Croatians | 99.5 /100 | #29 | Exceptional 48.9% |
Demographics Similar to Salvadorans by Currently Married
In terms of currently married, the demographic groups most similar to Salvadorans are Bermudan (43.5%, a difference of 0.020%), Indonesian (43.5%, a difference of 0.050%), Immigrants from Sudan (43.5%, a difference of 0.080%), Yaqui (43.4%, a difference of 0.10%), and Nigerian (43.4%, a difference of 0.11%).
| Demographics | Rating | Rank | Currently Married |
| Immigrants | Cuba | 0.1 /100 | #263 | Tragic 43.7% |
| Sudanese | 0.1 /100 | #264 | Tragic 43.7% |
| Immigrants | Bangladesh | 0.1 /100 | #265 | Tragic 43.6% |
| Ecuadorians | 0.1 /100 | #266 | Tragic 43.6% |
| Immigrants | Eritrea | 0.1 /100 | #267 | Tragic 43.6% |
| Spanish American Indians | 0.1 /100 | #268 | Tragic 43.6% |
| Immigrants | Sudan | 0.1 /100 | #269 | Tragic 43.5% |
| Salvadorans | 0.1 /100 | #270 | Tragic 43.5% |
| Bermudans | 0.1 /100 | #271 | Tragic 43.5% |
| Indonesians | 0.1 /100 | #272 | Tragic 43.5% |
| Yaqui | 0.1 /100 | #273 | Tragic 43.4% |
| Nigerians | 0.1 /100 | #274 | Tragic 43.4% |
| Colville | 0.1 /100 | #275 | Tragic 43.4% |
| Sierra Leoneans | 0.1 /100 | #276 | Tragic 43.4% |
| Immigrants | Nigeria | 0.1 /100 | #277 | Tragic 43.4% |