Bulgarian vs Belizean Currently Married
COMPARE
Bulgarian
Belizean
Currently Married
Currently Married Comparison
Bulgarians
Belizeans
49.1%
CURRENTLY MARRIED
99.7/ 100
METRIC RATING
22nd/ 347
METRIC RANK
42.2%
CURRENTLY MARRIED
0.0/ 100
METRIC RATING
300th/ 347
METRIC RANK
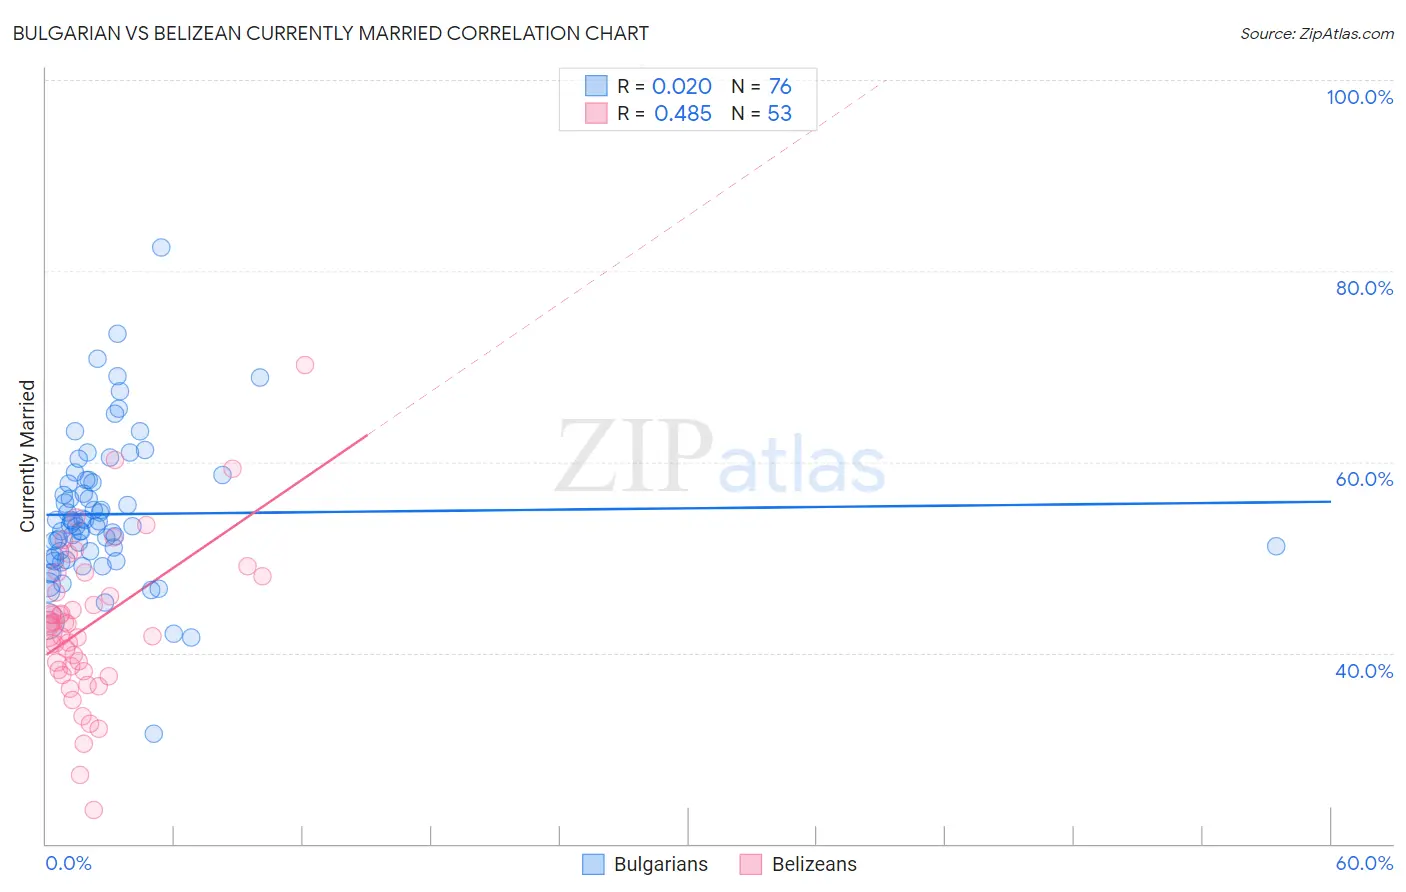
Bulgarian vs Belizean Currently Married Correlation Chart
The statistical analysis conducted on geographies consisting of 205,615,003 people shows no correlation between the proportion of Bulgarians and percentage of population currently married in the United States with a correlation coefficient (R) of 0.020 and weighted average of 49.1%. Similarly, the statistical analysis conducted on geographies consisting of 144,212,972 people shows a moderate positive correlation between the proportion of Belizeans and percentage of population currently married in the United States with a correlation coefficient (R) of 0.485 and weighted average of 42.2%, a difference of 16.5%.
Currently Married Correlation Summary
| Measurement | Bulgarian | Belizean |
| Minimum | 31.5% | 23.5% |
| Maximum | 82.5% | 70.1% |
| Range | 51.0% | 46.6% |
| Mean | 54.5% | 42.9% |
| Median | 53.3% | 42.8% |
| Interquartile 25% (IQ1) | 49.9% | 38.2% |
| Interquartile 75% (IQ3) | 58.0% | 47.1% |
| Interquartile Range (IQR) | 8.1% | 9.0% |
| Standard Deviation (Sample) | 7.7% | 8.1% |
| Standard Deviation (Population) | 7.6% | 8.1% |
Similar Demographics by Currently Married
Demographics Similar to Bulgarians by Currently Married
In terms of currently married, the demographic groups most similar to Bulgarians are Immigrants from Pakistan (49.1%, a difference of 0.11%), Scottish (49.2%, a difference of 0.22%), Lithuanian (49.0%, a difference of 0.22%), Maltese (49.0%, a difference of 0.23%), and Immigrants from Korea (49.0%, a difference of 0.28%).
| Demographics | Rating | Rank | Currently Married |
| Pennsylvania Germans | 99.9 /100 | #15 | Exceptional 49.6% |
| Chinese | 99.9 /100 | #16 | Exceptional 49.5% |
| Scandinavians | 99.9 /100 | #17 | Exceptional 49.5% |
| Immigrants | Scotland | 99.8 /100 | #18 | Exceptional 49.3% |
| Europeans | 99.8 /100 | #19 | Exceptional 49.3% |
| Luxembourgers | 99.8 /100 | #20 | Exceptional 49.3% |
| Scottish | 99.8 /100 | #21 | Exceptional 49.2% |
| Bulgarians | 99.7 /100 | #22 | Exceptional 49.1% |
| Immigrants | Pakistan | 99.7 /100 | #23 | Exceptional 49.1% |
| Lithuanians | 99.6 /100 | #24 | Exceptional 49.0% |
| Maltese | 99.6 /100 | #25 | Exceptional 49.0% |
| Immigrants | Korea | 99.6 /100 | #26 | Exceptional 49.0% |
| Burmese | 99.6 /100 | #27 | Exceptional 48.9% |
| Welsh | 99.5 /100 | #28 | Exceptional 48.9% |
| Croatians | 99.5 /100 | #29 | Exceptional 48.9% |
Demographics Similar to Belizeans by Currently Married
In terms of currently married, the demographic groups most similar to Belizeans are Liberian (42.2%, a difference of 0.10%), Immigrants from Honduras (42.2%, a difference of 0.13%), Cheyenne (42.2%, a difference of 0.22%), Immigrants from Yemen (42.1%, a difference of 0.24%), and Menominee (42.3%, a difference of 0.33%).
| Demographics | Rating | Rank | Currently Married |
| Yuman | 0.0 /100 | #293 | Tragic 42.6% |
| Hondurans | 0.0 /100 | #294 | Tragic 42.5% |
| Immigrants | Western Africa | 0.0 /100 | #295 | Tragic 42.4% |
| Menominee | 0.0 /100 | #296 | Tragic 42.3% |
| Cheyenne | 0.0 /100 | #297 | Tragic 42.2% |
| Immigrants | Honduras | 0.0 /100 | #298 | Tragic 42.2% |
| Liberians | 0.0 /100 | #299 | Tragic 42.2% |
| Belizeans | 0.0 /100 | #300 | Tragic 42.2% |
| Immigrants | Yemen | 0.0 /100 | #301 | Tragic 42.1% |
| Immigrants | Zaire | 0.0 /100 | #302 | Tragic 42.0% |
| Sioux | 0.0 /100 | #303 | Tragic 41.9% |
| Immigrants | Bahamas | 0.0 /100 | #304 | Tragic 41.9% |
| Immigrants | Trinidad and Tobago | 0.0 /100 | #305 | Tragic 41.9% |
| Immigrants | Guyana | 0.0 /100 | #306 | Tragic 41.9% |
| Africans | 0.0 /100 | #307 | Tragic 41.8% |