Bulgarian vs Fijian Currently Married
COMPARE
Bulgarian
Fijian
Currently Married
Currently Married Comparison
Bulgarians
Fijians
49.1%
CURRENTLY MARRIED
99.7/ 100
METRIC RATING
22nd/ 347
METRIC RANK
46.3%
CURRENTLY MARRIED
30.3/ 100
METRIC RATING
189th/ 347
METRIC RANK
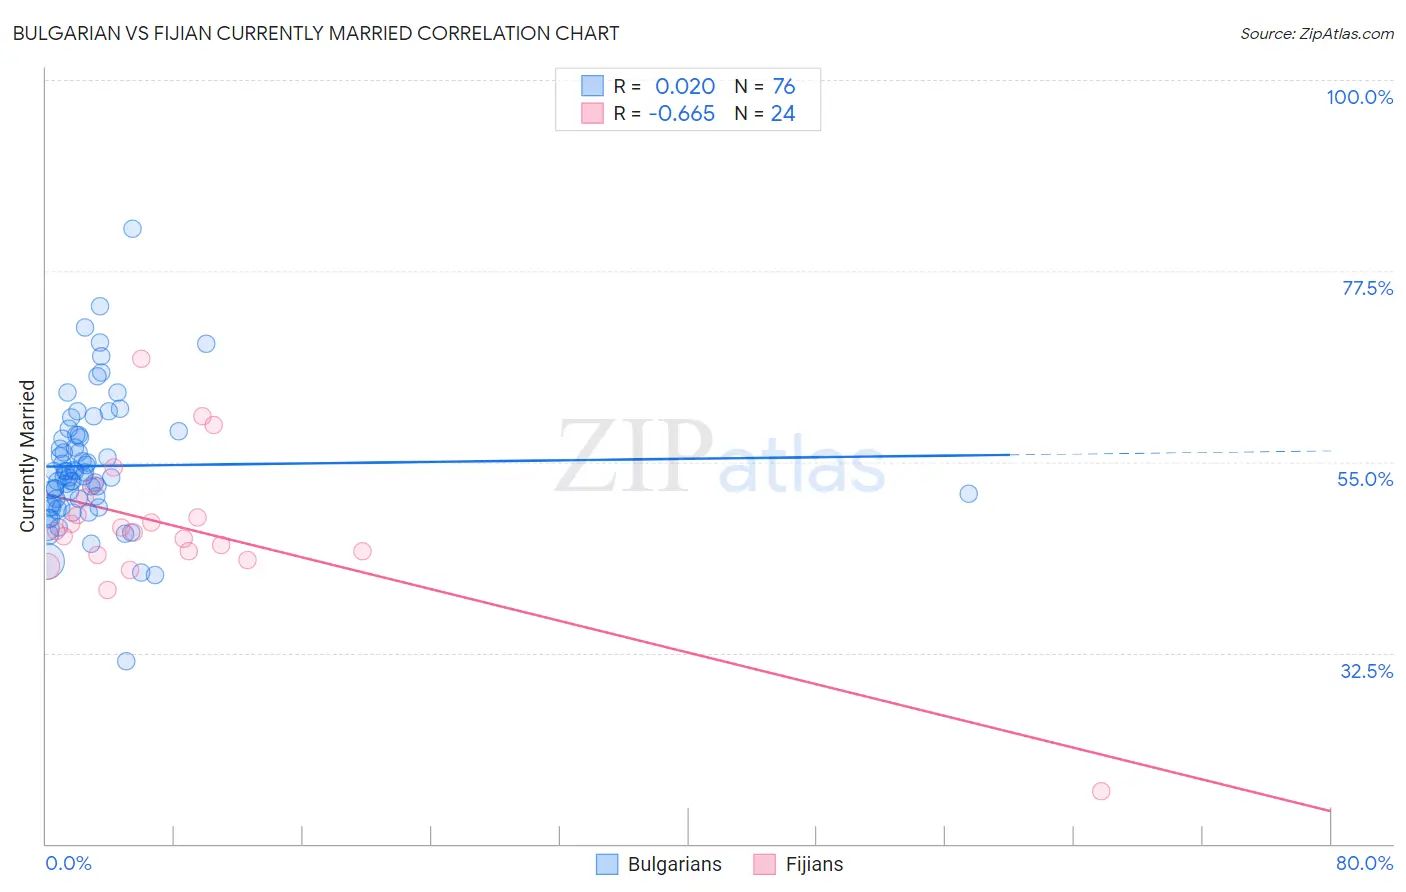
Bulgarian vs Fijian Currently Married Correlation Chart
The statistical analysis conducted on geographies consisting of 205,615,003 people shows no correlation between the proportion of Bulgarians and percentage of population currently married in the United States with a correlation coefficient (R) of 0.020 and weighted average of 49.1%. Similarly, the statistical analysis conducted on geographies consisting of 55,948,768 people shows a significant negative correlation between the proportion of Fijians and percentage of population currently married in the United States with a correlation coefficient (R) of -0.665 and weighted average of 46.3%, a difference of 6.1%.
Currently Married Correlation Summary
| Measurement | Bulgarian | Fijian |
| Minimum | 31.5% | 16.2% |
| Maximum | 82.5% | 67.1% |
| Range | 51.0% | 50.9% |
| Mean | 54.5% | 47.2% |
| Median | 53.3% | 46.8% |
| Interquartile 25% (IQ1) | 49.9% | 44.2% |
| Interquartile 75% (IQ3) | 58.0% | 49.8% |
| Interquartile Range (IQR) | 8.1% | 5.5% |
| Standard Deviation (Sample) | 7.7% | 9.1% |
| Standard Deviation (Population) | 7.6% | 8.9% |
Similar Demographics by Currently Married
Demographics Similar to Bulgarians by Currently Married
In terms of currently married, the demographic groups most similar to Bulgarians are Immigrants from Pakistan (49.1%, a difference of 0.11%), Scottish (49.2%, a difference of 0.22%), Lithuanian (49.0%, a difference of 0.22%), Maltese (49.0%, a difference of 0.23%), and Immigrants from Korea (49.0%, a difference of 0.28%).
| Demographics | Rating | Rank | Currently Married |
| Pennsylvania Germans | 99.9 /100 | #15 | Exceptional 49.6% |
| Chinese | 99.9 /100 | #16 | Exceptional 49.5% |
| Scandinavians | 99.9 /100 | #17 | Exceptional 49.5% |
| Immigrants | Scotland | 99.8 /100 | #18 | Exceptional 49.3% |
| Europeans | 99.8 /100 | #19 | Exceptional 49.3% |
| Luxembourgers | 99.8 /100 | #20 | Exceptional 49.3% |
| Scottish | 99.8 /100 | #21 | Exceptional 49.2% |
| Bulgarians | 99.7 /100 | #22 | Exceptional 49.1% |
| Immigrants | Pakistan | 99.7 /100 | #23 | Exceptional 49.1% |
| Lithuanians | 99.6 /100 | #24 | Exceptional 49.0% |
| Maltese | 99.6 /100 | #25 | Exceptional 49.0% |
| Immigrants | Korea | 99.6 /100 | #26 | Exceptional 49.0% |
| Burmese | 99.6 /100 | #27 | Exceptional 48.9% |
| Welsh | 99.5 /100 | #28 | Exceptional 48.9% |
| Croatians | 99.5 /100 | #29 | Exceptional 48.9% |
Demographics Similar to Fijians by Currently Married
In terms of currently married, the demographic groups most similar to Fijians are Choctaw (46.3%, a difference of 0.050%), Colombian (46.3%, a difference of 0.060%), Immigrants from France (46.2%, a difference of 0.12%), Immigrants from Peru (46.4%, a difference of 0.21%), and Soviet Union (46.2%, a difference of 0.21%).
| Demographics | Rating | Rank | Currently Married |
| Potawatomi | 41.9 /100 | #182 | Average 46.5% |
| Immigrants | Northern Africa | 39.7 /100 | #183 | Fair 46.5% |
| Brazilians | 39.3 /100 | #184 | Fair 46.4% |
| Mongolians | 37.6 /100 | #185 | Fair 46.4% |
| Immigrants | Chile | 36.8 /100 | #186 | Fair 46.4% |
| Immigrants | Peru | 35.3 /100 | #187 | Fair 46.4% |
| Colombians | 31.8 /100 | #188 | Fair 46.3% |
| Fijians | 30.3 /100 | #189 | Fair 46.3% |
| Choctaw | 29.1 /100 | #190 | Fair 46.3% |
| Immigrants | France | 27.7 /100 | #191 | Fair 46.2% |
| Soviet Union | 25.7 /100 | #192 | Fair 46.2% |
| Immigrants | Fiji | 25.0 /100 | #193 | Fair 46.2% |
| South Americans | 23.8 /100 | #194 | Fair 46.1% |
| Immigrants | Nepal | 23.7 /100 | #195 | Fair 46.1% |
| Immigrants | Bosnia and Herzegovina | 22.2 /100 | #196 | Fair 46.1% |