British West Indian vs Immigrants from Zaire Family Households
COMPARE
British West Indian
Immigrants from Zaire
Family Households
Family Households Comparison
British West Indians
Immigrants from Zaire
62.8%
FAMILY HOUSEHOLDS
0.1/ 100
METRIC RATING
286th/ 347
METRIC RANK
59.2%
FAMILY HOUSEHOLDS
0.0/ 100
METRIC RATING
345th/ 347
METRIC RANK
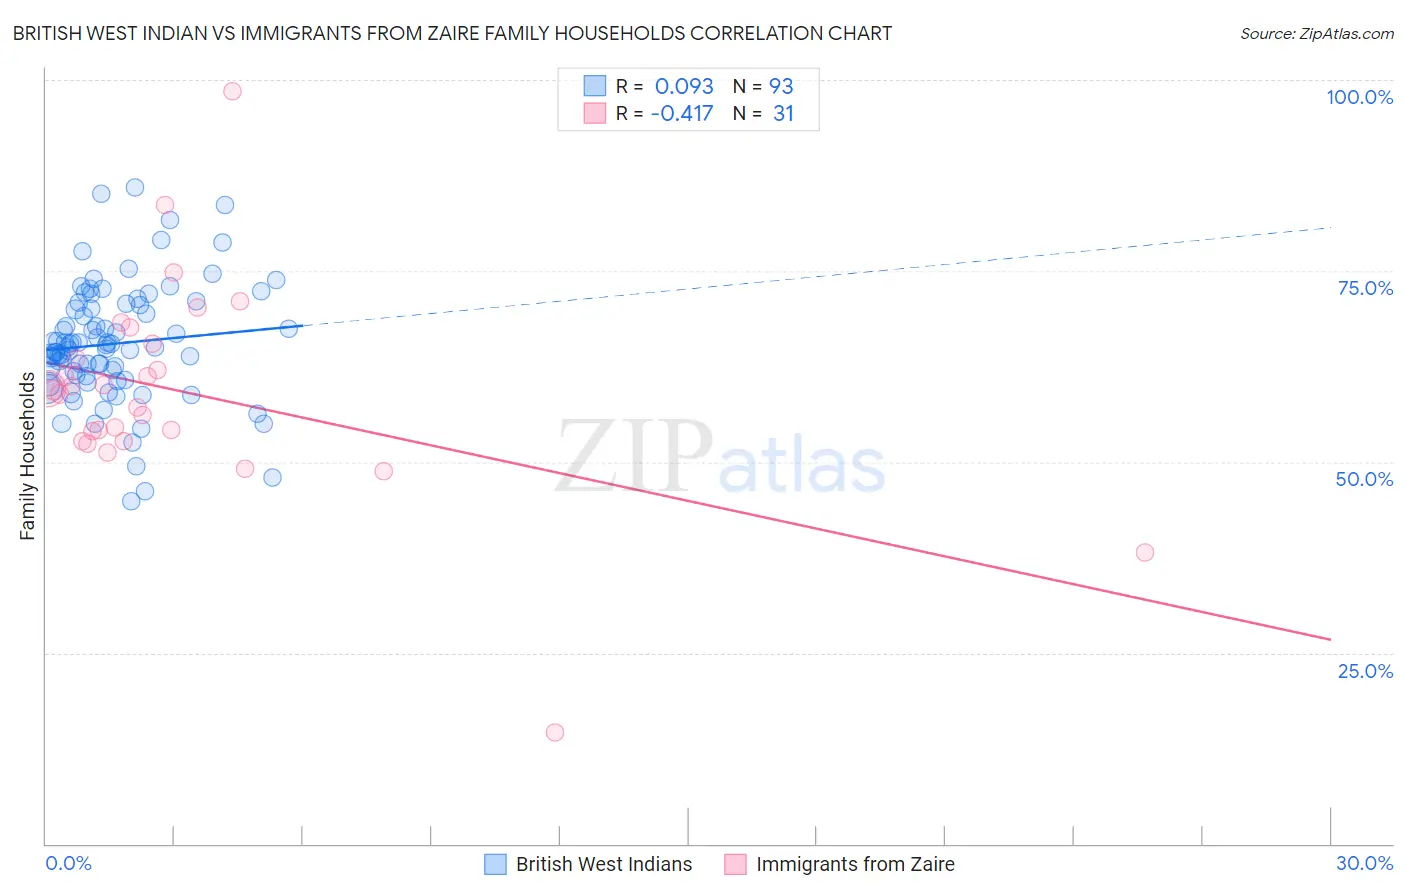
British West Indian vs Immigrants from Zaire Family Households Correlation Chart
The statistical analysis conducted on geographies consisting of 152,638,699 people shows a slight positive correlation between the proportion of British West Indians and percentage of family households in the United States with a correlation coefficient (R) of 0.093 and weighted average of 62.8%. Similarly, the statistical analysis conducted on geographies consisting of 107,246,225 people shows a moderate negative correlation between the proportion of Immigrants from Zaire and percentage of family households in the United States with a correlation coefficient (R) of -0.417 and weighted average of 59.2%, a difference of 6.1%.
Family Households Correlation Summary
| Measurement | British West Indian | Immigrants from Zaire |
| Minimum | 44.8% | 14.5% |
| Maximum | 86.0% | 98.6% |
| Range | 41.2% | 84.1% |
| Mean | 65.5% | 59.2% |
| Median | 65.0% | 59.4% |
| Interquartile 25% (IQ1) | 61.2% | 52.7% |
| Interquartile 75% (IQ3) | 70.6% | 65.5% |
| Interquartile Range (IQR) | 9.4% | 12.8% |
| Standard Deviation (Sample) | 7.8% | 14.0% |
| Standard Deviation (Population) | 7.7% | 13.7% |
Similar Demographics by Family Households
Demographics Similar to British West Indians by Family Households
In terms of family households, the demographic groups most similar to British West Indians are Latvian (62.8%, a difference of 0.0%), Immigrants from Uganda (62.7%, a difference of 0.020%), Mongolian (62.8%, a difference of 0.030%), Immigrants from Nepal (62.7%, a difference of 0.11%), and Australian (62.8%, a difference of 0.13%).
| Demographics | Rating | Rank | Family Households |
| Immigrants | Yemen | 0.2 /100 | #279 | Tragic 63.0% |
| Immigrants | Bulgaria | 0.2 /100 | #280 | Tragic 63.0% |
| Estonians | 0.2 /100 | #281 | Tragic 62.9% |
| New Zealanders | 0.1 /100 | #282 | Tragic 62.9% |
| Immigrants | Denmark | 0.1 /100 | #283 | Tragic 62.9% |
| Australians | 0.1 /100 | #284 | Tragic 62.8% |
| Mongolians | 0.1 /100 | #285 | Tragic 62.8% |
| British West Indians | 0.1 /100 | #286 | Tragic 62.8% |
| Latvians | 0.1 /100 | #287 | Tragic 62.8% |
| Immigrants | Uganda | 0.1 /100 | #288 | Tragic 62.7% |
| Immigrants | Nepal | 0.1 /100 | #289 | Tragic 62.7% |
| Immigrants | Grenada | 0.0 /100 | #290 | Tragic 62.6% |
| U.S. Virgin Islanders | 0.0 /100 | #291 | Tragic 62.6% |
| Immigrants | Burma/Myanmar | 0.0 /100 | #292 | Tragic 62.6% |
| Immigrants | Sweden | 0.0 /100 | #293 | Tragic 62.5% |
Demographics Similar to Immigrants from Zaire by Family Households
In terms of family households, the demographic groups most similar to Immigrants from Zaire are Immigrants from Congo (59.2%, a difference of 0.14%), Senegalese (59.8%, a difference of 1.1%), Sudanese (60.0%, a difference of 1.4%), Immigrants from Senegal (60.1%, a difference of 1.6%), and Immigrants from Sudan (60.2%, a difference of 1.7%).
| Demographics | Rating | Rank | Family Households |
| Immigrants | Ethiopia | 0.0 /100 | #333 | Tragic 61.2% |
| Immigrants | Eastern Africa | 0.0 /100 | #334 | Tragic 61.1% |
| Carpatho Rusyns | 0.0 /100 | #335 | Tragic 61.1% |
| German Russians | 0.0 /100 | #336 | Tragic 60.9% |
| Soviet Union | 0.0 /100 | #337 | Tragic 60.9% |
| Immigrants | Eritrea | 0.0 /100 | #338 | Tragic 60.8% |
| Immigrants | Saudi Arabia | 0.0 /100 | #339 | Tragic 60.7% |
| Immigrants | Sudan | 0.0 /100 | #340 | Tragic 60.2% |
| Immigrants | Senegal | 0.0 /100 | #341 | Tragic 60.1% |
| Sudanese | 0.0 /100 | #342 | Tragic 60.0% |
| Senegalese | 0.0 /100 | #343 | Tragic 59.8% |
| Immigrants | Congo | 0.0 /100 | #344 | Tragic 59.2% |
| Immigrants | Zaire | 0.0 /100 | #345 | Tragic 59.2% |
| Somalis | 0.0 /100 | #346 | Tragic 57.6% |
| Immigrants | Somalia | 0.0 /100 | #347 | Tragic 56.7% |