British West Indian vs Celtic Family Households
COMPARE
British West Indian
Celtic
Family Households
Family Households Comparison
British West Indians
Celtics
62.8%
FAMILY HOUSEHOLDS
0.1/ 100
METRIC RATING
286th/ 347
METRIC RANK
63.8%
FAMILY HOUSEHOLDS
8.0/ 100
METRIC RATING
214th/ 347
METRIC RANK
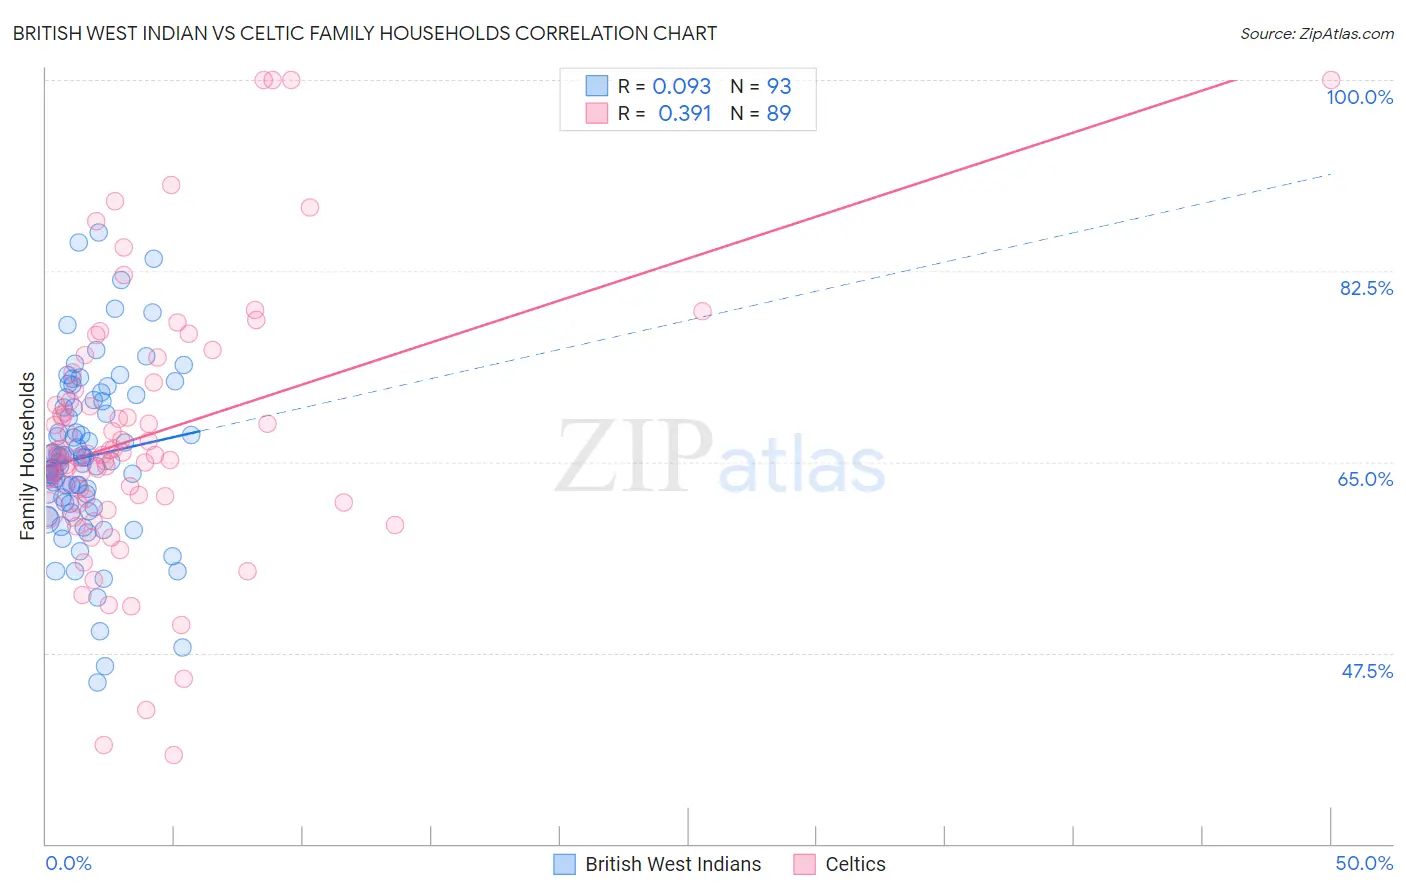
British West Indian vs Celtic Family Households Correlation Chart
The statistical analysis conducted on geographies consisting of 152,638,699 people shows a slight positive correlation between the proportion of British West Indians and percentage of family households in the United States with a correlation coefficient (R) of 0.093 and weighted average of 62.8%. Similarly, the statistical analysis conducted on geographies consisting of 168,846,430 people shows a mild positive correlation between the proportion of Celtics and percentage of family households in the United States with a correlation coefficient (R) of 0.391 and weighted average of 63.8%, a difference of 1.6%.
Family Households Correlation Summary
| Measurement | British West Indian | Celtic |
| Minimum | 44.8% | 38.1% |
| Maximum | 86.0% | 100.0% |
| Range | 41.2% | 61.9% |
| Mean | 65.5% | 67.4% |
| Median | 65.0% | 65.8% |
| Interquartile 25% (IQ1) | 61.2% | 61.4% |
| Interquartile 75% (IQ3) | 70.6% | 71.9% |
| Interquartile Range (IQR) | 9.4% | 10.5% |
| Standard Deviation (Sample) | 7.8% | 12.1% |
| Standard Deviation (Population) | 7.7% | 12.0% |
Similar Demographics by Family Households
Demographics Similar to British West Indians by Family Households
In terms of family households, the demographic groups most similar to British West Indians are Latvian (62.8%, a difference of 0.0%), Immigrants from Uganda (62.7%, a difference of 0.020%), Mongolian (62.8%, a difference of 0.030%), Immigrants from Nepal (62.7%, a difference of 0.11%), and Australian (62.8%, a difference of 0.13%).
| Demographics | Rating | Rank | Family Households |
| Immigrants | Yemen | 0.2 /100 | #279 | Tragic 63.0% |
| Immigrants | Bulgaria | 0.2 /100 | #280 | Tragic 63.0% |
| Estonians | 0.2 /100 | #281 | Tragic 62.9% |
| New Zealanders | 0.1 /100 | #282 | Tragic 62.9% |
| Immigrants | Denmark | 0.1 /100 | #283 | Tragic 62.9% |
| Australians | 0.1 /100 | #284 | Tragic 62.8% |
| Mongolians | 0.1 /100 | #285 | Tragic 62.8% |
| British West Indians | 0.1 /100 | #286 | Tragic 62.8% |
| Latvians | 0.1 /100 | #287 | Tragic 62.8% |
| Immigrants | Uganda | 0.1 /100 | #288 | Tragic 62.7% |
| Immigrants | Nepal | 0.1 /100 | #289 | Tragic 62.7% |
| Immigrants | Grenada | 0.0 /100 | #290 | Tragic 62.6% |
| U.S. Virgin Islanders | 0.0 /100 | #291 | Tragic 62.6% |
| Immigrants | Burma/Myanmar | 0.0 /100 | #292 | Tragic 62.6% |
| Immigrants | Sweden | 0.0 /100 | #293 | Tragic 62.5% |
Demographics Similar to Celtics by Family Households
In terms of family households, the demographic groups most similar to Celtics are Belgian (63.8%, a difference of 0.020%), Croatian (63.8%, a difference of 0.030%), Immigrants from Northern Europe (63.8%, a difference of 0.040%), Osage (63.7%, a difference of 0.050%), and Marshallese (63.7%, a difference of 0.050%).
| Demographics | Rating | Rank | Family Households |
| Nigerians | 11.5 /100 | #207 | Poor 63.9% |
| Immigrants | Bangladesh | 11.4 /100 | #208 | Poor 63.9% |
| Sierra Leoneans | 11.2 /100 | #209 | Poor 63.9% |
| Immigrants | Thailand | 9.6 /100 | #210 | Tragic 63.8% |
| Shoshone | 9.4 /100 | #211 | Tragic 63.8% |
| Immigrants | Netherlands | 9.4 /100 | #212 | Tragic 63.8% |
| Immigrants | Northern Europe | 8.8 /100 | #213 | Tragic 63.8% |
| Celtics | 8.0 /100 | #214 | Tragic 63.8% |
| Belgians | 7.6 /100 | #215 | Tragic 63.8% |
| Croatians | 7.3 /100 | #216 | Tragic 63.8% |
| Osage | 7.0 /100 | #217 | Tragic 63.7% |
| Marshallese | 6.9 /100 | #218 | Tragic 63.7% |
| Macedonians | 6.5 /100 | #219 | Tragic 63.7% |
| Immigrants | Europe | 6.4 /100 | #220 | Tragic 63.7% |
| Immigrants | South Africa | 5.9 /100 | #221 | Tragic 63.7% |