British vs Tsimshian Professional Degree
COMPARE
British
Tsimshian
Professional Degree
Professional Degree Comparison
British
Tsimshian
5.0%
PROFESSIONAL DEGREE
98.0/ 100
METRIC RATING
109th/ 347
METRIC RANK
3.2%
PROFESSIONAL DEGREE
0.0/ 100
METRIC RATING
321st/ 347
METRIC RANK
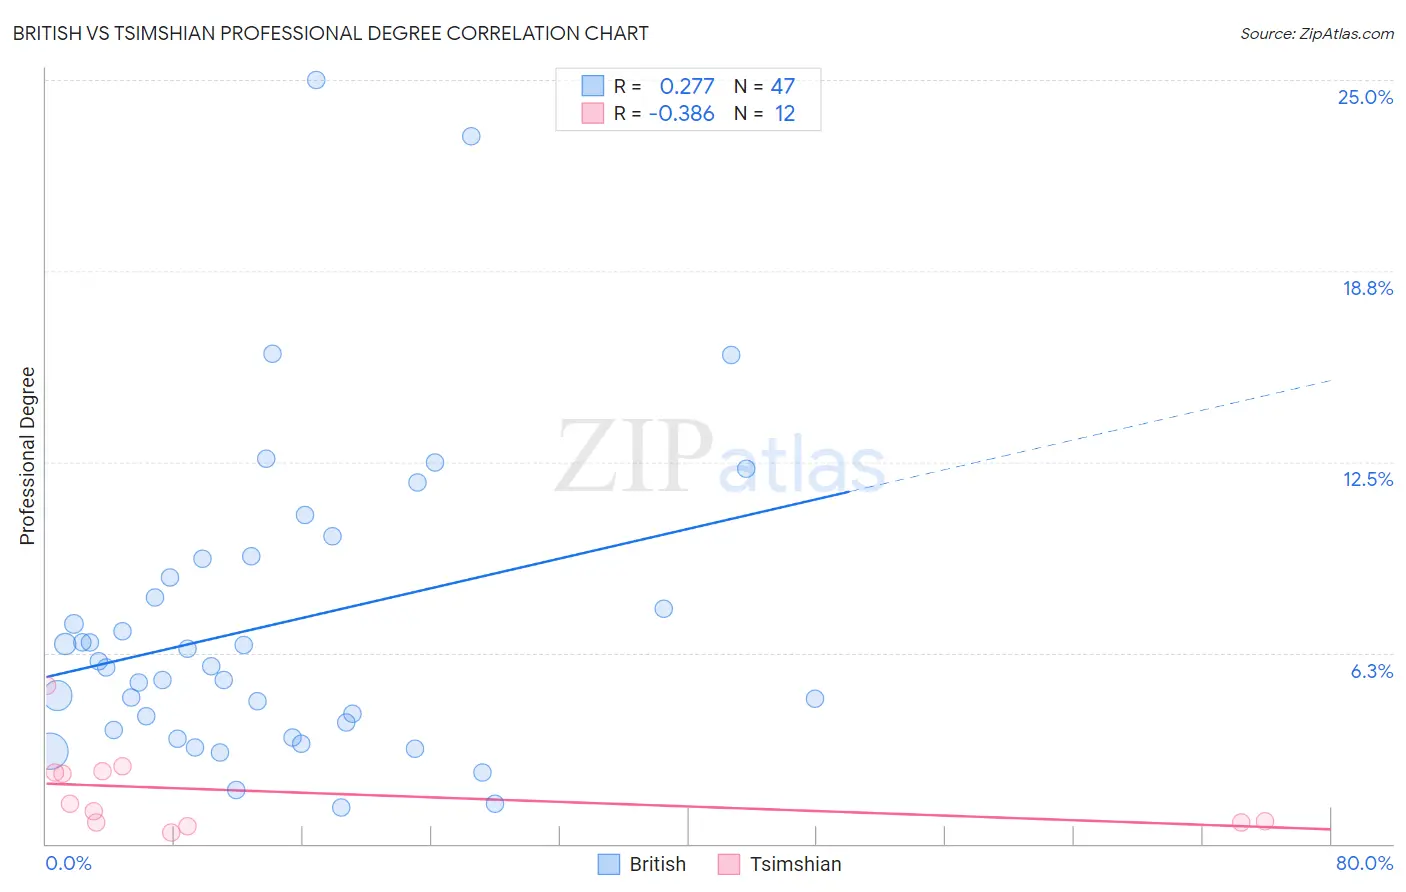
British vs Tsimshian Professional Degree Correlation Chart
The statistical analysis conducted on geographies consisting of 527,483,146 people shows a weak positive correlation between the proportion of British and percentage of population with at least professional degree education in the United States with a correlation coefficient (R) of 0.277 and weighted average of 5.0%. Similarly, the statistical analysis conducted on geographies consisting of 15,614,727 people shows a mild negative correlation between the proportion of Tsimshian and percentage of population with at least professional degree education in the United States with a correlation coefficient (R) of -0.386 and weighted average of 3.2%, a difference of 58.3%.
Professional Degree Correlation Summary
| Measurement | British | Tsimshian |
| Minimum | 1.2% | 0.38% |
| Maximum | 25.0% | 5.2% |
| Range | 23.8% | 4.8% |
| Mean | 7.2% | 1.7% |
| Median | 5.8% | 1.2% |
| Interquartile 25% (IQ1) | 3.7% | 0.71% |
| Interquartile 75% (IQ3) | 9.3% | 2.4% |
| Interquartile Range (IQR) | 5.6% | 1.6% |
| Standard Deviation (Sample) | 5.1% | 1.4% |
| Standard Deviation (Population) | 5.0% | 1.3% |
Similar Demographics by Professional Degree
Demographics Similar to British by Professional Degree
In terms of professional degree, the demographic groups most similar to British are Immigrants from Southern Europe (5.0%, a difference of 0.020%), Maltese (5.0%, a difference of 0.060%), Lebanese (5.0%, a difference of 0.15%), Immigrants from Ukraine (5.0%, a difference of 0.18%), and Immigrants from Uganda (5.0%, a difference of 0.21%).
| Demographics | Rating | Rank | Professional Degree |
| Ukrainians | 98.5 /100 | #102 | Exceptional 5.1% |
| Immigrants | Northern Africa | 98.4 /100 | #103 | Exceptional 5.1% |
| Arabs | 98.2 /100 | #104 | Exceptional 5.0% |
| Immigrants | Uganda | 98.2 /100 | #105 | Exceptional 5.0% |
| Immigrants | Ukraine | 98.2 /100 | #106 | Exceptional 5.0% |
| Maltese | 98.1 /100 | #107 | Exceptional 5.0% |
| Immigrants | Southern Europe | 98.1 /100 | #108 | Exceptional 5.0% |
| British | 98.0 /100 | #109 | Exceptional 5.0% |
| Lebanese | 98.0 /100 | #110 | Exceptional 5.0% |
| Brazilians | 97.4 /100 | #111 | Exceptional 5.0% |
| Taiwanese | 97.3 /100 | #112 | Exceptional 5.0% |
| Immigrants | Pakistan | 97.2 /100 | #113 | Exceptional 5.0% |
| Immigrants | Morocco | 96.8 /100 | #114 | Exceptional 5.0% |
| Moroccans | 96.8 /100 | #115 | Exceptional 5.0% |
| Venezuelans | 96.3 /100 | #116 | Exceptional 4.9% |
Demographics Similar to Tsimshian by Professional Degree
In terms of professional degree, the demographic groups most similar to Tsimshian are Seminole (3.2%, a difference of 0.36%), Hispanic or Latino (3.2%, a difference of 0.36%), Inupiat (3.2%, a difference of 0.44%), Crow (3.2%, a difference of 0.72%), and Yaqui (3.2%, a difference of 0.78%).
| Demographics | Rating | Rank | Professional Degree |
| Mexican American Indians | 0.1 /100 | #314 | Tragic 3.3% |
| Immigrants | Laos | 0.1 /100 | #315 | Tragic 3.2% |
| Puerto Ricans | 0.1 /100 | #316 | Tragic 3.2% |
| Nepalese | 0.1 /100 | #317 | Tragic 3.2% |
| Immigrants | Micronesia | 0.1 /100 | #318 | Tragic 3.2% |
| Choctaw | 0.1 /100 | #319 | Tragic 3.2% |
| Seminole | 0.1 /100 | #320 | Tragic 3.2% |
| Tsimshian | 0.0 /100 | #321 | Tragic 3.2% |
| Hispanics or Latinos | 0.0 /100 | #322 | Tragic 3.2% |
| Inupiat | 0.0 /100 | #323 | Tragic 3.2% |
| Crow | 0.0 /100 | #324 | Tragic 3.2% |
| Yaqui | 0.0 /100 | #325 | Tragic 3.2% |
| Menominee | 0.0 /100 | #326 | Tragic 3.1% |
| Dutch West Indians | 0.0 /100 | #327 | Tragic 3.1% |
| Creek | 0.0 /100 | #328 | Tragic 3.1% |