Chickasaw vs Cheyenne Single Father Households
COMPARE
Chickasaw
Cheyenne
Single Father Households
Single Father Households Comparison
Chickasaw
Cheyenne
2.8%
SINGLE FATHER HOUSEHOLDS
0.0/ 100
METRIC RATING
295th/ 347
METRIC RANK
2.9%
SINGLE FATHER HOUSEHOLDS
0.0/ 100
METRIC RATING
315th/ 347
METRIC RANK
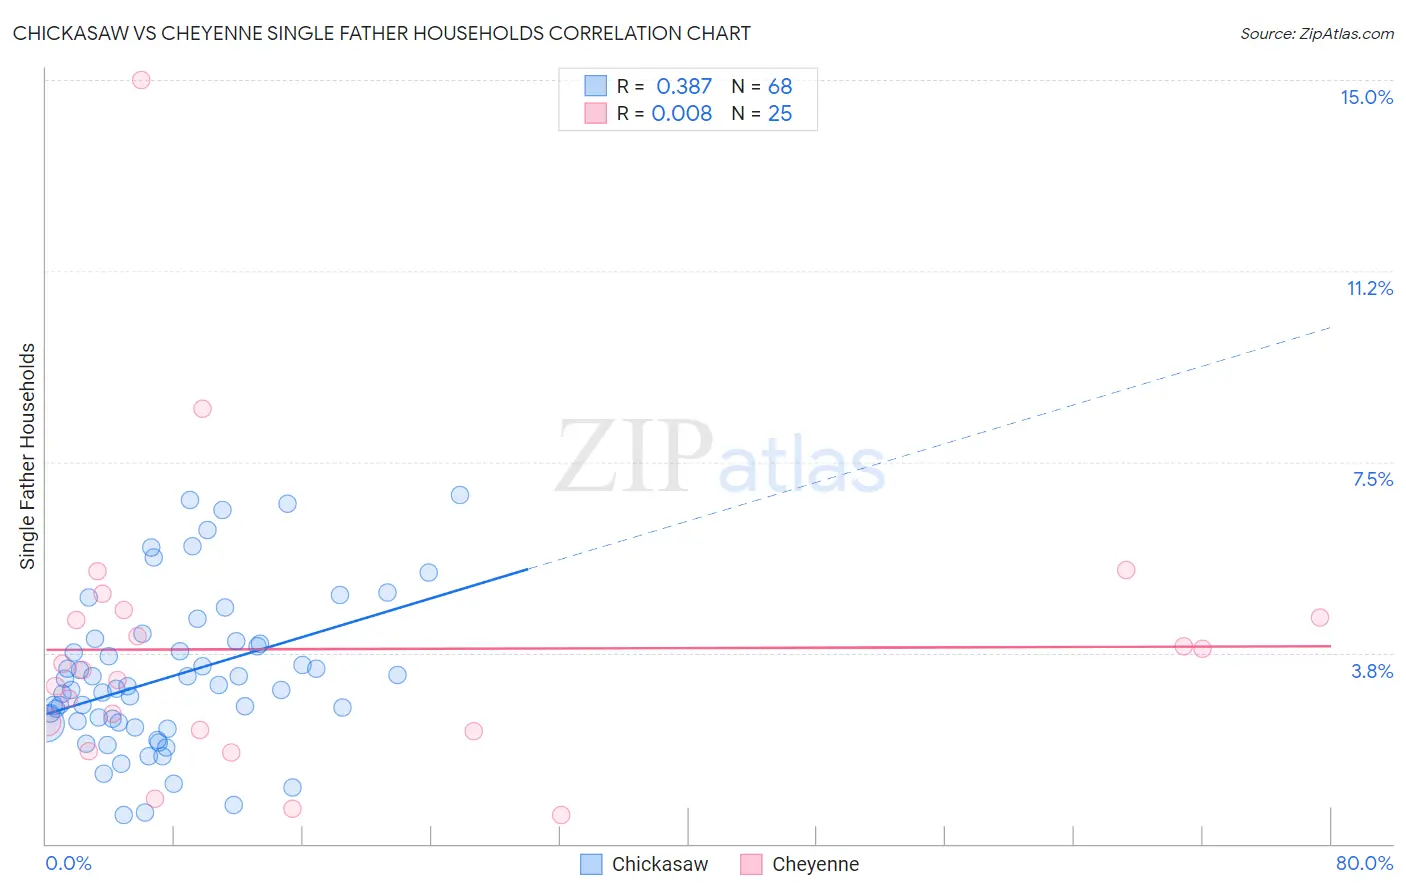
Chickasaw vs Cheyenne Single Father Households Correlation Chart
The statistical analysis conducted on geographies consisting of 147,211,099 people shows a mild positive correlation between the proportion of Chickasaw and percentage of single father households in the United States with a correlation coefficient (R) of 0.387 and weighted average of 2.8%. Similarly, the statistical analysis conducted on geographies consisting of 80,479,252 people shows no correlation between the proportion of Cheyenne and percentage of single father households in the United States with a correlation coefficient (R) of 0.008 and weighted average of 2.9%, a difference of 6.1%.
Single Father Households Correlation Summary
| Measurement | Chickasaw | Cheyenne |
| Minimum | 0.57% | 0.55% |
| Maximum | 6.8% | 15.0% |
| Range | 6.3% | 14.4% |
| Mean | 3.3% | 3.8% |
| Median | 3.1% | 3.4% |
| Interquartile 25% (IQ1) | 2.4% | 2.2% |
| Interquartile 75% (IQ3) | 3.9% | 4.5% |
| Interquartile Range (IQR) | 1.6% | 2.3% |
| Standard Deviation (Sample) | 1.5% | 2.9% |
| Standard Deviation (Population) | 1.5% | 2.8% |
Demographics Similar to Chickasaw and Cheyenne by Single Father Households
In terms of single father households, the demographic groups most similar to Chickasaw are Japanese (2.8%, a difference of 0.020%), Honduran (2.8%, a difference of 0.10%), Cree (2.8%, a difference of 0.59%), Lumbee (2.8%, a difference of 0.97%), and Kiowa (2.8%, a difference of 1.4%). Similarly, the demographic groups most similar to Cheyenne are Salvadoran (2.9%, a difference of 0.39%), Arapaho (2.9%, a difference of 0.64%), Tsimshian (2.9%, a difference of 1.1%), Spanish American Indian (2.9%, a difference of 1.6%), and Immigrants from Laos (2.9%, a difference of 2.1%).
| Demographics | Rating | Rank | Single Father Households |
| Chickasaw | 0.0 /100 | #295 | Tragic 2.8% |
| Japanese | 0.0 /100 | #296 | Tragic 2.8% |
| Hondurans | 0.0 /100 | #297 | Tragic 2.8% |
| Cree | 0.0 /100 | #298 | Tragic 2.8% |
| Lumbee | 0.0 /100 | #299 | Tragic 2.8% |
| Kiowa | 0.0 /100 | #300 | Tragic 2.8% |
| Immigrants | Latin America | 0.0 /100 | #301 | Tragic 2.8% |
| Spanish Americans | 0.0 /100 | #302 | Tragic 2.8% |
| Immigrants | Honduras | 0.0 /100 | #303 | Tragic 2.8% |
| Mexican American Indians | 0.0 /100 | #304 | Tragic 2.8% |
| Hispanics or Latinos | 0.0 /100 | #305 | Tragic 2.8% |
| Immigrants | Azores | 0.0 /100 | #306 | Tragic 2.8% |
| Hopi | 0.0 /100 | #307 | Tragic 2.8% |
| Apache | 0.0 /100 | #308 | Tragic 2.8% |
| Central Americans | 0.0 /100 | #309 | Tragic 2.9% |
| Immigrants | Laos | 0.0 /100 | #310 | Tragic 2.9% |
| Spanish American Indians | 0.0 /100 | #311 | Tragic 2.9% |
| Tsimshian | 0.0 /100 | #312 | Tragic 2.9% |
| Arapaho | 0.0 /100 | #313 | Tragic 2.9% |
| Salvadorans | 0.0 /100 | #314 | Tragic 2.9% |
| Cheyenne | 0.0 /100 | #315 | Tragic 2.9% |