Immigrants from Honduras vs Belizean Average Family Size
COMPARE
Immigrants from Honduras
Belizean
Average Family Size
Average Family Size Comparison
Immigrants from Honduras
Belizeans
3.36
AVERAGE FAMILY SIZE
100.0/ 100
METRIC RATING
55th/ 347
METRIC RANK
3.39
AVERAGE FAMILY SIZE
100.0/ 100
METRIC RATING
40th/ 347
METRIC RANK
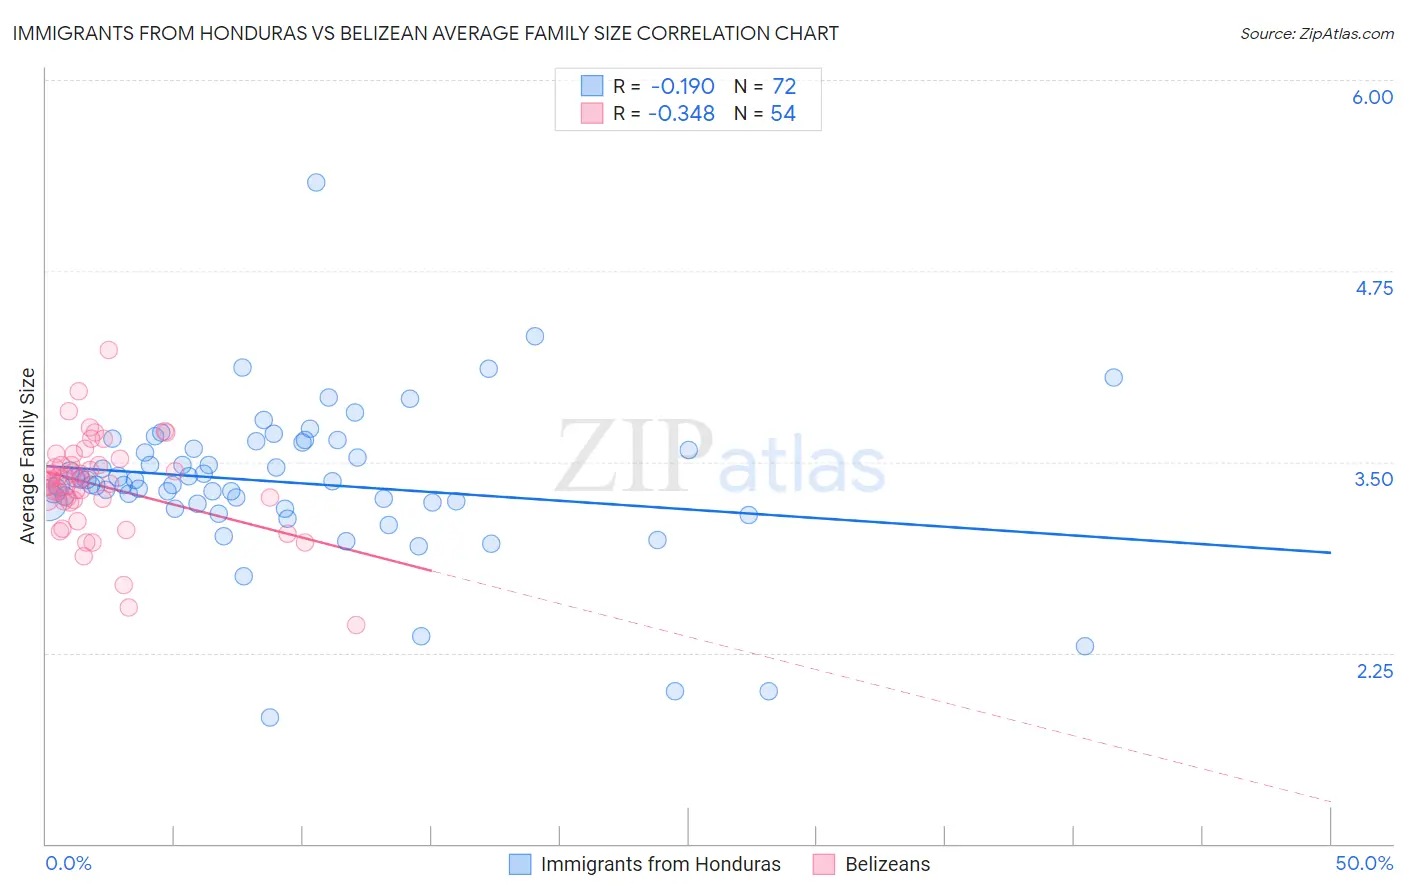
Immigrants from Honduras vs Belizean Average Family Size Correlation Chart
The statistical analysis conducted on geographies consisting of 322,466,970 people shows a poor negative correlation between the proportion of Immigrants from Honduras and average family size in the United States with a correlation coefficient (R) of -0.190 and weighted average of 3.36. Similarly, the statistical analysis conducted on geographies consisting of 144,152,249 people shows a mild negative correlation between the proportion of Belizeans and average family size in the United States with a correlation coefficient (R) of -0.348 and weighted average of 3.39, a difference of 0.89%.
Average Family Size Correlation Summary
| Measurement | Immigrants from Honduras | Belizean |
| Minimum | 1.83 | 2.43 |
| Maximum | 5.33 | 4.23 |
| Range | 3.50 | 1.80 |
| Mean | 3.36 | 3.34 |
| Median | 3.36 | 3.37 |
| Interquartile 25% (IQ1) | 3.23 | 3.24 |
| Interquartile 75% (IQ3) | 3.61 | 3.48 |
| Interquartile Range (IQR) | 0.38 | 0.24 |
| Standard Deviation (Sample) | 0.51 | 0.32 |
| Standard Deviation (Population) | 0.50 | 0.32 |
Demographics Similar to Immigrants from Honduras and Belizeans by Average Family Size
In terms of average family size, the demographic groups most similar to Immigrants from Honduras are Immigrants from South Eastern Asia (3.36, a difference of 0.040%), Korean (3.36, a difference of 0.060%), Immigrants from Dominican Republic (3.35, a difference of 0.070%), Fijian (3.36, a difference of 0.090%), and Sri Lankan (3.35, a difference of 0.12%). Similarly, the demographic groups most similar to Belizeans are Immigrants from Haiti (3.39, a difference of 0.12%), Marshallese (3.38, a difference of 0.17%), Immigrants from Belize (3.39, a difference of 0.20%), Immigrants from Vietnam (3.38, a difference of 0.23%), and Immigrants from Philippines (3.37, a difference of 0.33%).
| Demographics | Rating | Rank | Average Family Size |
| Guyanese | 100.0 /100 | #37 | Exceptional 3.40 |
| Immigrants | Belize | 100.0 /100 | #38 | Exceptional 3.39 |
| Immigrants | Haiti | 100.0 /100 | #39 | Exceptional 3.39 |
| Belizeans | 100.0 /100 | #40 | Exceptional 3.39 |
| Marshallese | 100.0 /100 | #41 | Exceptional 3.38 |
| Immigrants | Vietnam | 100.0 /100 | #42 | Exceptional 3.38 |
| Immigrants | Philippines | 100.0 /100 | #43 | Exceptional 3.37 |
| Alaska Natives | 100.0 /100 | #44 | Exceptional 3.37 |
| Shoshone | 100.0 /100 | #45 | Exceptional 3.37 |
| Haitians | 100.0 /100 | #46 | Exceptional 3.37 |
| Vietnamese | 100.0 /100 | #47 | Exceptional 3.37 |
| Immigrants | Nicaragua | 100.0 /100 | #48 | Exceptional 3.37 |
| Bangladeshis | 100.0 /100 | #49 | Exceptional 3.37 |
| Immigrants | Bangladesh | 100.0 /100 | #50 | Exceptional 3.36 |
| Nicaraguans | 100.0 /100 | #51 | Exceptional 3.36 |
| Fijians | 100.0 /100 | #52 | Exceptional 3.36 |
| Koreans | 100.0 /100 | #53 | Exceptional 3.36 |
| Immigrants | South Eastern Asia | 100.0 /100 | #54 | Exceptional 3.36 |
| Immigrants | Honduras | 100.0 /100 | #55 | Exceptional 3.36 |
| Immigrants | Dominican Republic | 100.0 /100 | #56 | Exceptional 3.35 |
| Sri Lankans | 100.0 /100 | #57 | Exceptional 3.35 |