Brazilian vs Swedish Currently Married
COMPARE
Brazilian
Swedish
Currently Married
Currently Married Comparison
Brazilians
Swedes
46.4%
CURRENTLY MARRIED
39.3/ 100
METRIC RATING
184th/ 347
METRIC RANK
50.0%
CURRENTLY MARRIED
100.0/ 100
METRIC RATING
8th/ 347
METRIC RANK
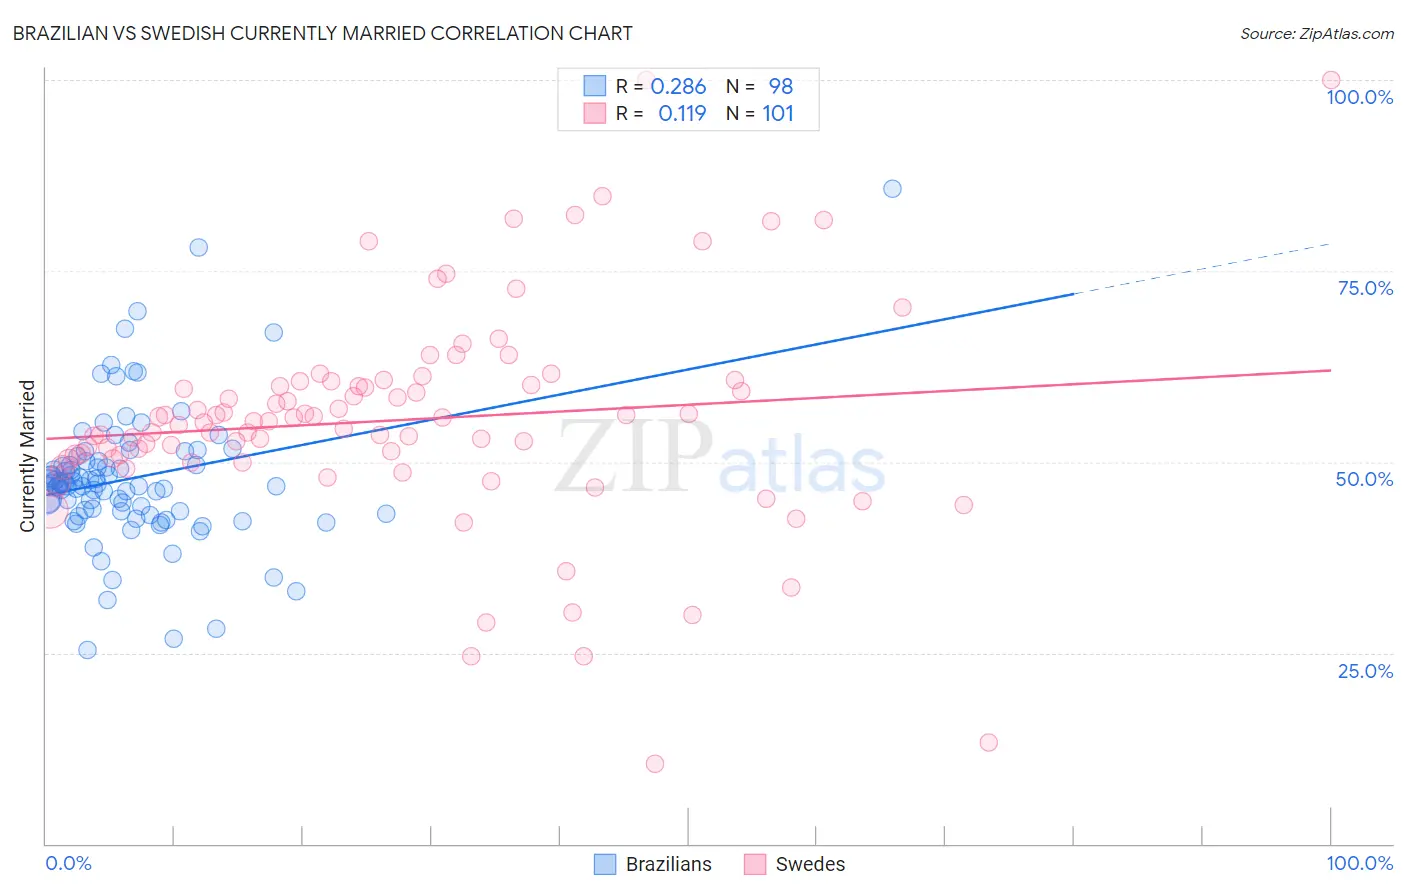
Brazilian vs Swedish Currently Married Correlation Chart
The statistical analysis conducted on geographies consisting of 323,904,544 people shows a weak positive correlation between the proportion of Brazilians and percentage of population currently married in the United States with a correlation coefficient (R) of 0.286 and weighted average of 46.4%. Similarly, the statistical analysis conducted on geographies consisting of 539,138,052 people shows a poor positive correlation between the proportion of Swedes and percentage of population currently married in the United States with a correlation coefficient (R) of 0.119 and weighted average of 50.0%, a difference of 7.5%.
Currently Married Correlation Summary
| Measurement | Brazilian | Swedish |
| Minimum | 25.3% | 10.5% |
| Maximum | 85.7% | 100.0% |
| Range | 60.4% | 89.5% |
| Mean | 47.9% | 55.5% |
| Median | 47.2% | 55.3% |
| Interquartile 25% (IQ1) | 43.5% | 50.4% |
| Interquartile 75% (IQ3) | 50.1% | 60.2% |
| Interquartile Range (IQR) | 6.6% | 9.9% |
| Standard Deviation (Sample) | 9.1% | 14.4% |
| Standard Deviation (Population) | 9.1% | 14.4% |
Similar Demographics by Currently Married
Demographics Similar to Brazilians by Currently Married
In terms of currently married, the demographic groups most similar to Brazilians are Immigrants from Northern Africa (46.5%, a difference of 0.020%), Mongolian (46.4%, a difference of 0.070%), Potawatomi (46.5%, a difference of 0.10%), Immigrants from Chile (46.4%, a difference of 0.10%), and Ottawa (46.5%, a difference of 0.14%).
| Demographics | Rating | Rank | Currently Married |
| Israelis | 48.6 /100 | #177 | Average 46.6% |
| Chickasaw | 47.8 /100 | #178 | Average 46.6% |
| Immigrants | Oceania | 44.6 /100 | #179 | Average 46.5% |
| Costa Ricans | 43.7 /100 | #180 | Average 46.5% |
| Ottawa | 43.0 /100 | #181 | Average 46.5% |
| Potawatomi | 41.9 /100 | #182 | Average 46.5% |
| Immigrants | Northern Africa | 39.7 /100 | #183 | Fair 46.5% |
| Brazilians | 39.3 /100 | #184 | Fair 46.4% |
| Mongolians | 37.6 /100 | #185 | Fair 46.4% |
| Immigrants | Chile | 36.8 /100 | #186 | Fair 46.4% |
| Immigrants | Peru | 35.3 /100 | #187 | Fair 46.4% |
| Colombians | 31.8 /100 | #188 | Fair 46.3% |
| Fijians | 30.3 /100 | #189 | Fair 46.3% |
| Choctaw | 29.1 /100 | #190 | Fair 46.3% |
| Immigrants | France | 27.7 /100 | #191 | Fair 46.2% |
Demographics Similar to Swedes by Currently Married
In terms of currently married, the demographic groups most similar to Swedes are Immigrants from South Central Asia (50.0%, a difference of 0.13%), Czech (49.9%, a difference of 0.19%), Filipino (49.7%, a difference of 0.45%), English (49.7%, a difference of 0.46%), and Swiss (49.7%, a difference of 0.46%).
| Demographics | Rating | Rank | Currently Married |
| Immigrants | India | 100.0 /100 | #1 | Exceptional 51.8% |
| Thais | 100.0 /100 | #2 | Exceptional 50.9% |
| Assyrians/Chaldeans/Syriacs | 100.0 /100 | #3 | Exceptional 50.8% |
| Immigrants | Taiwan | 100.0 /100 | #4 | Exceptional 50.7% |
| Danes | 100.0 /100 | #5 | Exceptional 50.5% |
| Norwegians | 100.0 /100 | #6 | Exceptional 50.2% |
| Immigrants | South Central Asia | 100.0 /100 | #7 | Exceptional 50.0% |
| Swedes | 100.0 /100 | #8 | Exceptional 50.0% |
| Czechs | 99.9 /100 | #9 | Exceptional 49.9% |
| Filipinos | 99.9 /100 | #10 | Exceptional 49.7% |
| English | 99.9 /100 | #11 | Exceptional 49.7% |
| Swiss | 99.9 /100 | #12 | Exceptional 49.7% |
| Dutch | 99.9 /100 | #13 | Exceptional 49.6% |
| Germans | 99.9 /100 | #14 | Exceptional 49.6% |
| Pennsylvania Germans | 99.9 /100 | #15 | Exceptional 49.6% |