Brazilian vs Immigrants from Ireland Householder Income Under 25 years
COMPARE
Brazilian
Immigrants from Ireland
Householder Income Under 25 years
Householder Income Under 25 years Comparison
Brazilians
Immigrants from Ireland
$54,335
HOUSEHOLDER INCOME UNDER 25 YEARS
99.5/ 100
METRIC RATING
87th/ 347
METRIC RANK
$57,075
HOUSEHOLDER INCOME UNDER 25 YEARS
100.0/ 100
METRIC RATING
20th/ 347
METRIC RANK
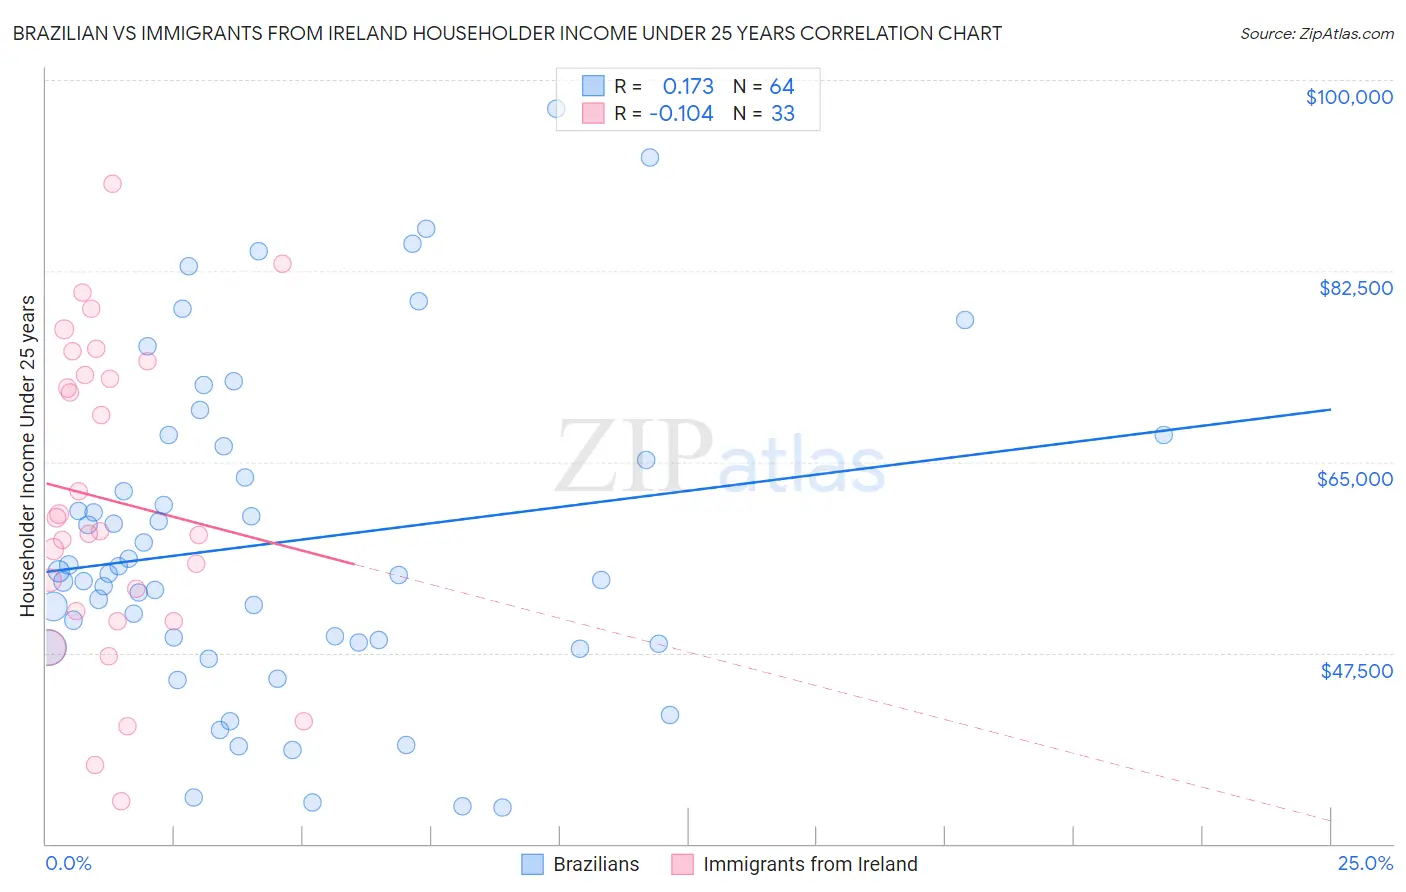
Brazilian vs Immigrants from Ireland Householder Income Under 25 years Correlation Chart
The statistical analysis conducted on geographies consisting of 277,651,798 people shows a poor positive correlation between the proportion of Brazilians and household income with householder under the age of 25 in the United States with a correlation coefficient (R) of 0.173 and weighted average of $54,335. Similarly, the statistical analysis conducted on geographies consisting of 203,844,468 people shows a poor negative correlation between the proportion of Immigrants from Ireland and household income with householder under the age of 25 in the United States with a correlation coefficient (R) of -0.104 and weighted average of $57,075, a difference of 5.0%.
Householder Income Under 25 years Correlation Summary
| Measurement | Brazilian | Immigrants from Ireland |
| Minimum | $33,271 | $33,875 |
| Maximum | $97,399 | $90,500 |
| Range | $64,128 | $56,625 |
| Mean | $57,617 | $61,493 |
| Median | $54,675 | $58,663 |
| Interquartile 25% (IQ1) | $48,409 | $50,831 |
| Interquartile 75% (IQ3) | $65,785 | $73,599 |
| Interquartile Range (IQR) | $17,376 | $22,768 |
| Standard Deviation (Sample) | $14,874 | $14,181 |
| Standard Deviation (Population) | $14,757 | $13,964 |
Similar Demographics by Householder Income Under 25 years
Demographics Similar to Brazilians by Householder Income Under 25 years
In terms of householder income under 25 years, the demographic groups most similar to Brazilians are Immigrants from Croatia ($54,343, a difference of 0.020%), Bulgarian ($54,352, a difference of 0.030%), Immigrants from Czechoslovakia ($54,352, a difference of 0.030%), Yakama ($54,321, a difference of 0.030%), and Laotian ($54,369, a difference of 0.060%).
| Demographics | Rating | Rank | Householder Income Under 25 years |
| Egyptians | 99.6 /100 | #80 | Exceptional $54,444 |
| Portuguese | 99.6 /100 | #81 | Exceptional $54,436 |
| Russians | 99.5 /100 | #82 | Exceptional $54,389 |
| Laotians | 99.5 /100 | #83 | Exceptional $54,369 |
| Bulgarians | 99.5 /100 | #84 | Exceptional $54,352 |
| Immigrants | Czechoslovakia | 99.5 /100 | #85 | Exceptional $54,352 |
| Immigrants | Croatia | 99.5 /100 | #86 | Exceptional $54,343 |
| Brazilians | 99.5 /100 | #87 | Exceptional $54,335 |
| Yakama | 99.5 /100 | #88 | Exceptional $54,321 |
| Immigrants | South America | 99.4 /100 | #89 | Exceptional $54,268 |
| Turks | 99.4 /100 | #90 | Exceptional $54,266 |
| Immigrants | Egypt | 99.3 /100 | #91 | Exceptional $54,239 |
| Immigrants | St. Vincent and the Grenadines | 99.3 /100 | #92 | Exceptional $54,230 |
| Immigrants | Argentina | 99.3 /100 | #93 | Exceptional $54,209 |
| Immigrants | Sierra Leone | 99.3 /100 | #94 | Exceptional $54,190 |
Demographics Similar to Immigrants from Ireland by Householder Income Under 25 years
In terms of householder income under 25 years, the demographic groups most similar to Immigrants from Ireland are Immigrants from Fiji ($57,074, a difference of 0.0%), Bhutanese ($57,078, a difference of 0.010%), Immigrants from Eastern Asia ($57,123, a difference of 0.080%), Asian ($57,003, a difference of 0.13%), and Tongan ($56,972, a difference of 0.18%).
| Demographics | Rating | Rank | Householder Income Under 25 years |
| Immigrants | South Central Asia | 100.0 /100 | #13 | Exceptional $57,818 |
| Filipinos | 100.0 /100 | #14 | Exceptional $57,740 |
| Koreans | 100.0 /100 | #15 | Exceptional $57,730 |
| Immigrants | Afghanistan | 100.0 /100 | #16 | Exceptional $57,478 |
| Sierra Leoneans | 100.0 /100 | #17 | Exceptional $57,272 |
| Immigrants | Eastern Asia | 100.0 /100 | #18 | Exceptional $57,123 |
| Bhutanese | 100.0 /100 | #19 | Exceptional $57,078 |
| Immigrants | Ireland | 100.0 /100 | #20 | Exceptional $57,075 |
| Immigrants | Fiji | 100.0 /100 | #21 | Exceptional $57,074 |
| Asians | 100.0 /100 | #22 | Exceptional $57,003 |
| Tongans | 100.0 /100 | #23 | Exceptional $56,972 |
| Immigrants | Singapore | 100.0 /100 | #24 | Exceptional $56,835 |
| Immigrants | Pakistan | 100.0 /100 | #25 | Exceptional $56,789 |
| Immigrants | Australia | 100.0 /100 | #26 | Exceptional $56,660 |
| Immigrants | North Macedonia | 100.0 /100 | #27 | Exceptional $56,503 |