Black/African American vs Immigrants from Laos 3rd Grade
COMPARE
Black/African American
Immigrants from Laos
3rd Grade
3rd Grade Comparison
Blacks/African Americans
Immigrants from Laos
97.7%
3RD GRADE
29.6/ 100
METRIC RATING
191st/ 347
METRIC RANK
96.6%
3RD GRADE
0.0/ 100
METRIC RATING
312th/ 347
METRIC RANK
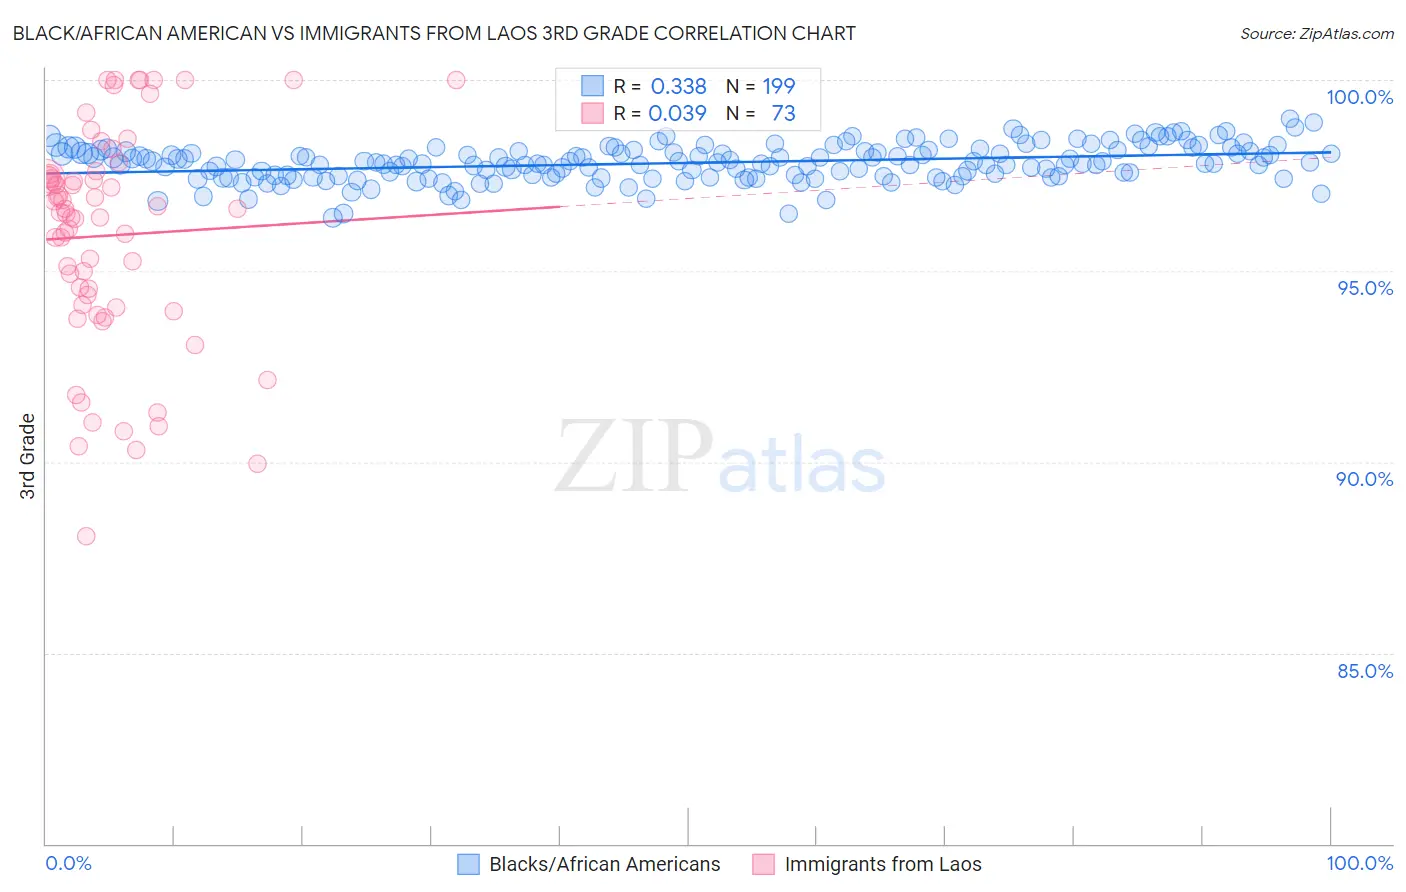
Black/African American vs Immigrants from Laos 3rd Grade Correlation Chart
The statistical analysis conducted on geographies consisting of 566,043,750 people shows a mild positive correlation between the proportion of Blacks/African Americans and percentage of population with at least 3rd grade education in the United States with a correlation coefficient (R) of 0.338 and weighted average of 97.7%. Similarly, the statistical analysis conducted on geographies consisting of 201,453,273 people shows no correlation between the proportion of Immigrants from Laos and percentage of population with at least 3rd grade education in the United States with a correlation coefficient (R) of 0.039 and weighted average of 96.6%, a difference of 1.1%.
3rd Grade Correlation Summary
| Measurement | Black/African American | Immigrants from Laos |
| Minimum | 96.4% | 88.0% |
| Maximum | 99.0% | 100.0% |
| Range | 2.6% | 12.0% |
| Mean | 97.8% | 95.9% |
| Median | 97.8% | 96.5% |
| Interquartile 25% (IQ1) | 97.5% | 94.1% |
| Interquartile 75% (IQ3) | 98.1% | 97.5% |
| Interquartile Range (IQR) | 0.67% | 3.4% |
| Standard Deviation (Sample) | 0.47% | 2.9% |
| Standard Deviation (Population) | 0.47% | 2.8% |
Similar Demographics by 3rd Grade
Demographics Similar to Blacks/African Americans by 3rd Grade
In terms of 3rd grade, the demographic groups most similar to Blacks/African Americans are Mongolian (97.7%, a difference of 0.0%), Panamanian (97.7%, a difference of 0.010%), Immigrants from Kenya (97.7%, a difference of 0.010%), Immigrants from Uganda (97.7%, a difference of 0.010%), and Immigrants from Egypt (97.7%, a difference of 0.010%).
| Demographics | Rating | Rank | 3rd Grade |
| Immigrants | Kazakhstan | 37.4 /100 | #184 | Fair 97.7% |
| Immigrants | Argentina | 37.0 /100 | #185 | Fair 97.7% |
| Portuguese | 36.2 /100 | #186 | Fair 97.7% |
| Natives/Alaskans | 35.2 /100 | #187 | Fair 97.7% |
| Immigrants | Taiwan | 34.2 /100 | #188 | Fair 97.7% |
| Pakistanis | 34.2 /100 | #189 | Fair 97.7% |
| Panamanians | 31.5 /100 | #190 | Fair 97.7% |
| Blacks/African Americans | 29.6 /100 | #191 | Fair 97.7% |
| Mongolians | 29.1 /100 | #192 | Fair 97.7% |
| Immigrants | Kenya | 28.2 /100 | #193 | Fair 97.7% |
| Immigrants | Uganda | 27.4 /100 | #194 | Fair 97.7% |
| Immigrants | Egypt | 26.8 /100 | #195 | Fair 97.7% |
| Paraguayans | 26.2 /100 | #196 | Fair 97.7% |
| Hawaiians | 25.7 /100 | #197 | Fair 97.7% |
| Guamanians/Chamorros | 23.6 /100 | #198 | Fair 97.7% |
Demographics Similar to Immigrants from Laos by 3rd Grade
In terms of 3rd grade, the demographic groups most similar to Immigrants from Laos are Immigrants from Ecuador (96.6%, a difference of 0.010%), Belizean (96.6%, a difference of 0.010%), Immigrants from Guyana (96.6%, a difference of 0.020%), Immigrants from the Azores (96.6%, a difference of 0.020%), and Immigrants from Burma/Myanmar (96.6%, a difference of 0.030%).
| Demographics | Rating | Rank | 3rd Grade |
| Central American Indians | 0.0 /100 | #305 | Tragic 96.7% |
| Guyanese | 0.0 /100 | #306 | Tragic 96.7% |
| Nicaraguans | 0.0 /100 | #307 | Tragic 96.7% |
| Immigrants | Haiti | 0.0 /100 | #308 | Tragic 96.7% |
| Sri Lankans | 0.0 /100 | #309 | Tragic 96.7% |
| Cape Verdeans | 0.0 /100 | #310 | Tragic 96.6% |
| Immigrants | Guyana | 0.0 /100 | #311 | Tragic 96.6% |
| Immigrants | Laos | 0.0 /100 | #312 | Tragic 96.6% |
| Immigrants | Ecuador | 0.0 /100 | #313 | Tragic 96.6% |
| Belizeans | 0.0 /100 | #314 | Tragic 96.6% |
| Immigrants | Azores | 0.0 /100 | #315 | Tragic 96.6% |
| Immigrants | Burma/Myanmar | 0.0 /100 | #316 | Tragic 96.6% |
| Immigrants | Bangladesh | 0.0 /100 | #317 | Tragic 96.6% |
| Hispanics or Latinos | 0.0 /100 | #318 | Tragic 96.5% |
| Vietnamese | 0.0 /100 | #319 | Tragic 96.5% |