Potawatomi vs Immigrants from Romania Single Father Households
COMPARE
Potawatomi
Immigrants from Romania
Single Father Households
Single Father Households Comparison
Potawatomi
Immigrants from Romania
2.5%
SINGLE FATHER HOUSEHOLDS
1.4/ 100
METRIC RATING
256th/ 347
METRIC RANK
2.1%
SINGLE FATHER HOUSEHOLDS
99.8/ 100
METRIC RATING
69th/ 347
METRIC RANK
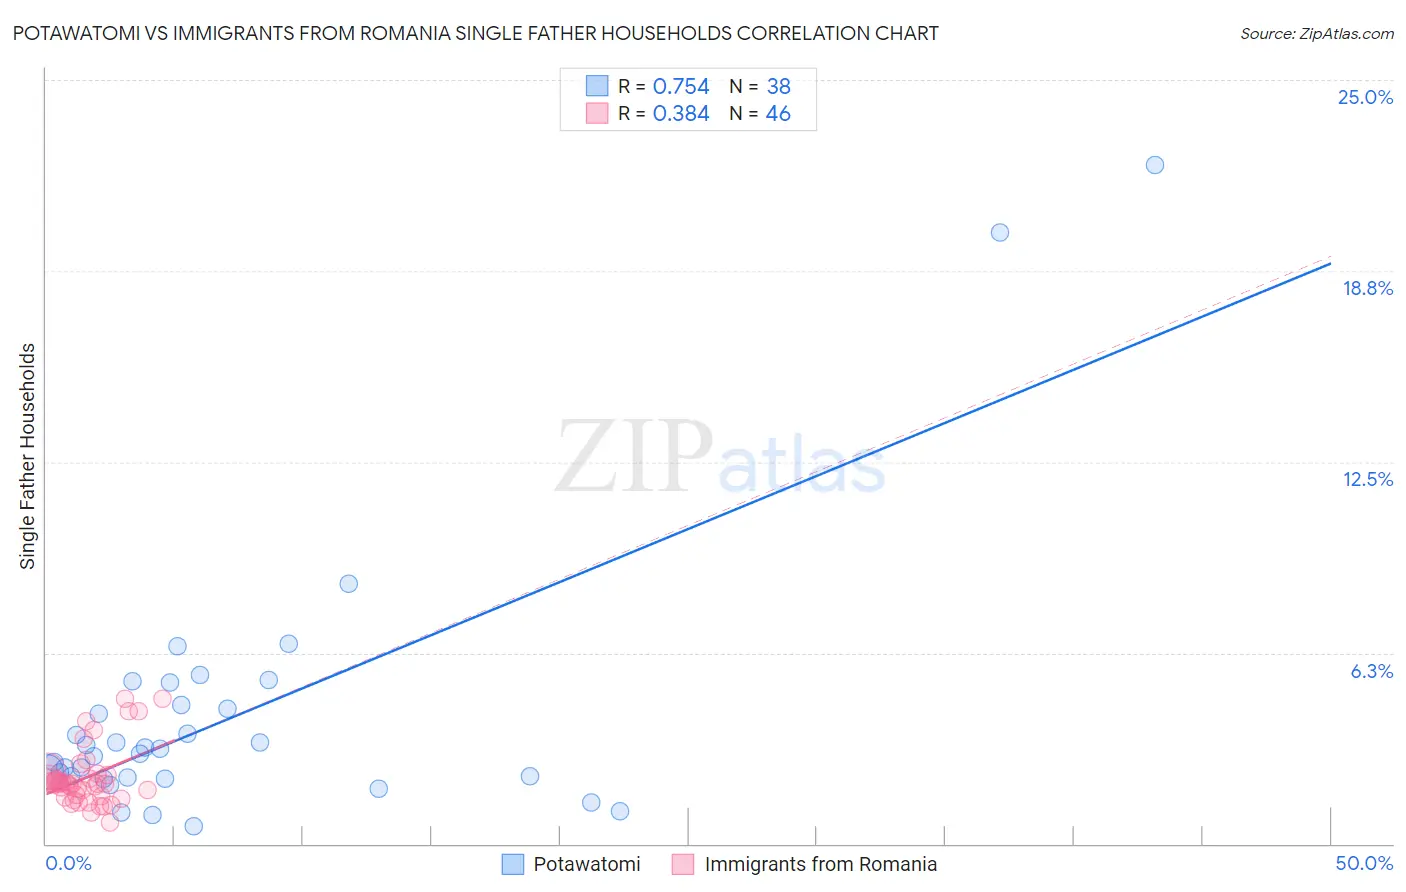
Potawatomi vs Immigrants from Romania Single Father Households Correlation Chart
The statistical analysis conducted on geographies consisting of 117,445,996 people shows a strong positive correlation between the proportion of Potawatomi and percentage of single father households in the United States with a correlation coefficient (R) of 0.754 and weighted average of 2.5%. Similarly, the statistical analysis conducted on geographies consisting of 255,577,760 people shows a mild positive correlation between the proportion of Immigrants from Romania and percentage of single father households in the United States with a correlation coefficient (R) of 0.384 and weighted average of 2.1%, a difference of 22.2%.
Single Father Households Correlation Summary
| Measurement | Potawatomi | Immigrants from Romania |
| Minimum | 0.58% | 0.71% |
| Maximum | 22.2% | 4.8% |
| Range | 21.6% | 4.1% |
| Mean | 4.2% | 2.2% |
| Median | 3.0% | 2.0% |
| Interquartile 25% (IQ1) | 2.2% | 1.6% |
| Interquartile 75% (IQ3) | 4.5% | 2.3% |
| Interquartile Range (IQR) | 2.4% | 0.71% |
| Standard Deviation (Sample) | 4.4% | 0.97% |
| Standard Deviation (Population) | 4.3% | 0.96% |
Similar Demographics by Single Father Households
Demographics Similar to Potawatomi by Single Father Households
In terms of single father households, the demographic groups most similar to Potawatomi are Tongan (2.5%, a difference of 0.060%), Immigrants from Congo (2.5%, a difference of 0.29%), Spanish (2.5%, a difference of 0.37%), Immigrants from Thailand (2.5%, a difference of 0.47%), and Immigrants from Somalia (2.5%, a difference of 0.51%).
| Demographics | Rating | Rank | Single Father Households |
| Immigrants | Cameroon | 2.3 /100 | #249 | Tragic 2.5% |
| Somalis | 2.1 /100 | #250 | Tragic 2.5% |
| Liberians | 2.0 /100 | #251 | Tragic 2.5% |
| Immigrants | Eritrea | 2.0 /100 | #252 | Tragic 2.5% |
| Immigrants | Somalia | 1.9 /100 | #253 | Tragic 2.5% |
| Immigrants | Thailand | 1.8 /100 | #254 | Tragic 2.5% |
| Tongans | 1.5 /100 | #255 | Tragic 2.5% |
| Potawatomi | 1.4 /100 | #256 | Tragic 2.5% |
| Immigrants | Congo | 1.2 /100 | #257 | Tragic 2.5% |
| Spanish | 1.1 /100 | #258 | Tragic 2.5% |
| Comanche | 1.0 /100 | #259 | Tragic 2.5% |
| Immigrants | Caribbean | 1.0 /100 | #260 | Tragic 2.5% |
| Immigrants | Belize | 0.9 /100 | #261 | Tragic 2.5% |
| Immigrants | Liberia | 0.8 /100 | #262 | Tragic 2.5% |
| Dominicans | 0.8 /100 | #263 | Tragic 2.5% |
Demographics Similar to Immigrants from Romania by Single Father Households
In terms of single father households, the demographic groups most similar to Immigrants from Romania are Immigrants from Denmark (2.1%, a difference of 0.020%), Immigrants from Italy (2.1%, a difference of 0.11%), Immigrants from Western Asia (2.1%, a difference of 0.16%), Egyptian (2.1%, a difference of 0.21%), and Immigrants from Kuwait (2.1%, a difference of 0.22%).
| Demographics | Rating | Rank | Single Father Households |
| Immigrants | Malaysia | 99.9 /100 | #62 | Exceptional 2.0% |
| Maltese | 99.9 /100 | #63 | Exceptional 2.0% |
| Mongolians | 99.9 /100 | #64 | Exceptional 2.1% |
| Paraguayans | 99.9 /100 | #65 | Exceptional 2.1% |
| Immigrants | Western Asia | 99.8 /100 | #66 | Exceptional 2.1% |
| Immigrants | Italy | 99.8 /100 | #67 | Exceptional 2.1% |
| Immigrants | Denmark | 99.8 /100 | #68 | Exceptional 2.1% |
| Immigrants | Romania | 99.8 /100 | #69 | Exceptional 2.1% |
| Egyptians | 99.8 /100 | #70 | Exceptional 2.1% |
| Immigrants | Kuwait | 99.8 /100 | #71 | Exceptional 2.1% |
| Immigrants | Spain | 99.8 /100 | #72 | Exceptional 2.1% |
| Immigrants | Bangladesh | 99.8 /100 | #73 | Exceptional 2.1% |
| Immigrants | Egypt | 99.8 /100 | #74 | Exceptional 2.1% |
| Immigrants | Sweden | 99.8 /100 | #75 | Exceptional 2.1% |
| Immigrants | Scotland | 99.8 /100 | #76 | Exceptional 2.1% |