Lithuanian vs Immigrants from Romania Single Father Households
COMPARE
Lithuanian
Immigrants from Romania
Single Father Households
Single Father Households Comparison
Lithuanians
Immigrants from Romania
2.1%
SINGLE FATHER HOUSEHOLDS
99.5/ 100
METRIC RATING
87th/ 347
METRIC RANK
2.1%
SINGLE FATHER HOUSEHOLDS
99.8/ 100
METRIC RATING
69th/ 347
METRIC RANK
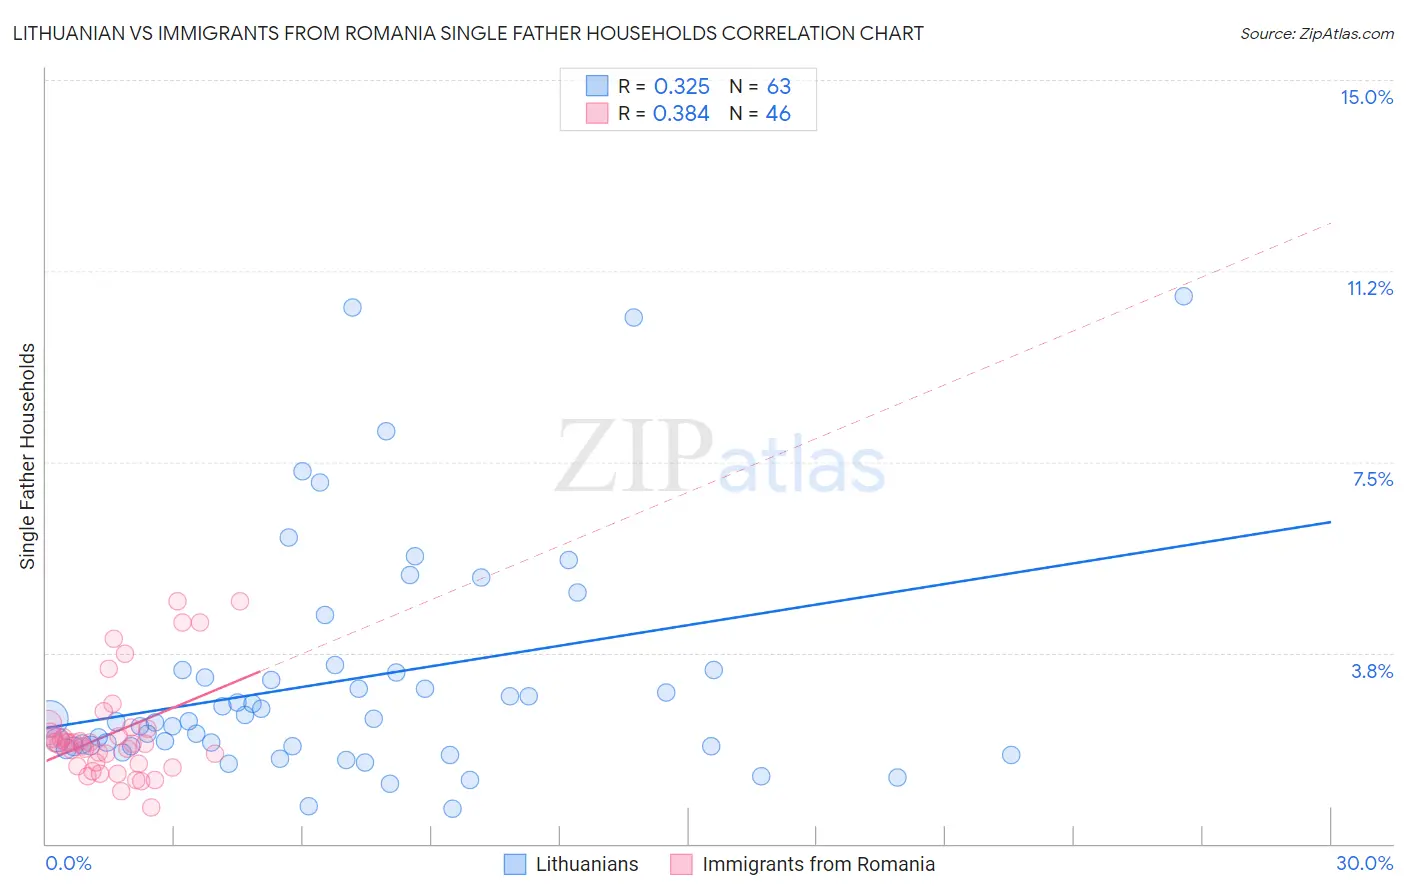
Lithuanian vs Immigrants from Romania Single Father Households Correlation Chart
The statistical analysis conducted on geographies consisting of 416,616,302 people shows a mild positive correlation between the proportion of Lithuanians and percentage of single father households in the United States with a correlation coefficient (R) of 0.325 and weighted average of 2.1%. Similarly, the statistical analysis conducted on geographies consisting of 255,577,760 people shows a mild positive correlation between the proportion of Immigrants from Romania and percentage of single father households in the United States with a correlation coefficient (R) of 0.384 and weighted average of 2.1%, a difference of 2.3%.
Single Father Households Correlation Summary
| Measurement | Lithuanian | Immigrants from Romania |
| Minimum | 0.69% | 0.71% |
| Maximum | 10.7% | 4.8% |
| Range | 10.0% | 4.1% |
| Mean | 3.2% | 2.2% |
| Median | 2.4% | 2.0% |
| Interquartile 25% (IQ1) | 1.9% | 1.6% |
| Interquartile 75% (IQ3) | 3.4% | 2.3% |
| Interquartile Range (IQR) | 1.5% | 0.71% |
| Standard Deviation (Sample) | 2.3% | 0.97% |
| Standard Deviation (Population) | 2.3% | 0.96% |
Demographics Similar to Lithuanians and Immigrants from Romania by Single Father Households
In terms of single father households, the demographic groups most similar to Lithuanians are Bhutanese (2.1%, a difference of 0.13%), Asian (2.1%, a difference of 0.51%), Immigrants from Hungary (2.1%, a difference of 0.59%), Carpatho Rusyn (2.1%, a difference of 0.63%), and Greek (2.1%, a difference of 0.93%). Similarly, the demographic groups most similar to Immigrants from Romania are Immigrants from Denmark (2.1%, a difference of 0.020%), Egyptian (2.1%, a difference of 0.21%), Immigrants from Kuwait (2.1%, a difference of 0.22%), Immigrants from Spain (2.1%, a difference of 0.22%), and Immigrants from Bangladesh (2.1%, a difference of 0.37%).
| Demographics | Rating | Rank | Single Father Households |
| Immigrants | Denmark | 99.8 /100 | #68 | Exceptional 2.1% |
| Immigrants | Romania | 99.8 /100 | #69 | Exceptional 2.1% |
| Egyptians | 99.8 /100 | #70 | Exceptional 2.1% |
| Immigrants | Kuwait | 99.8 /100 | #71 | Exceptional 2.1% |
| Immigrants | Spain | 99.8 /100 | #72 | Exceptional 2.1% |
| Immigrants | Bangladesh | 99.8 /100 | #73 | Exceptional 2.1% |
| Immigrants | Egypt | 99.8 /100 | #74 | Exceptional 2.1% |
| Immigrants | Sweden | 99.8 /100 | #75 | Exceptional 2.1% |
| Immigrants | Scotland | 99.8 /100 | #76 | Exceptional 2.1% |
| Immigrants | Saudi Arabia | 99.8 /100 | #77 | Exceptional 2.1% |
| Estonians | 99.7 /100 | #78 | Exceptional 2.1% |
| Immigrants | Asia | 99.7 /100 | #79 | Exceptional 2.1% |
| Immigrants | South Africa | 99.7 /100 | #80 | Exceptional 2.1% |
| Armenians | 99.7 /100 | #81 | Exceptional 2.1% |
| New Zealanders | 99.7 /100 | #82 | Exceptional 2.1% |
| Greeks | 99.7 /100 | #83 | Exceptional 2.1% |
| Carpatho Rusyns | 99.6 /100 | #84 | Exceptional 2.1% |
| Immigrants | Hungary | 99.6 /100 | #85 | Exceptional 2.1% |
| Asians | 99.6 /100 | #86 | Exceptional 2.1% |
| Lithuanians | 99.5 /100 | #87 | Exceptional 2.1% |
| Bhutanese | 99.5 /100 | #88 | Exceptional 2.1% |