Immigrants from Iran vs Panamanian Single Mother Households
COMPARE
Immigrants from Iran
Panamanian
Single Mother Households
Single Mother Households Comparison
Immigrants from Iran
Panamanians
4.8%
SINGLE MOTHER HOUSEHOLDS
100.0/ 100
METRIC RATING
3rd/ 347
METRIC RANK
7.1%
SINGLE MOTHER HOUSEHOLDS
0.9/ 100
METRIC RATING
238th/ 347
METRIC RANK
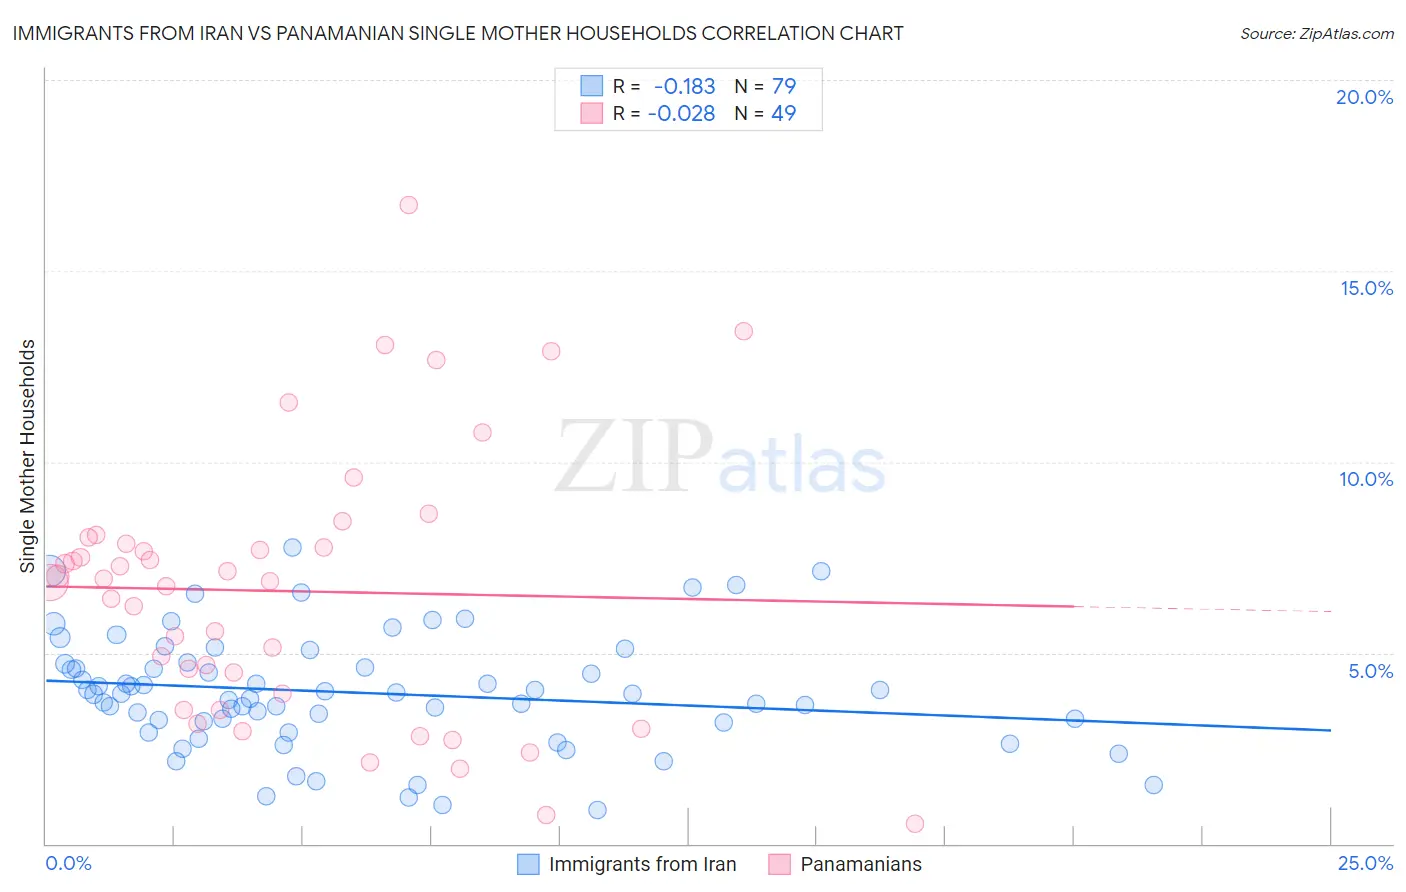
Immigrants from Iran vs Panamanian Single Mother Households Correlation Chart
The statistical analysis conducted on geographies consisting of 279,447,711 people shows a poor negative correlation between the proportion of Immigrants from Iran and percentage of single mother households in the United States with a correlation coefficient (R) of -0.183 and weighted average of 4.8%. Similarly, the statistical analysis conducted on geographies consisting of 280,762,519 people shows no correlation between the proportion of Panamanians and percentage of single mother households in the United States with a correlation coefficient (R) of -0.028 and weighted average of 7.1%, a difference of 48.2%.
Single Mother Households Correlation Summary
| Measurement | Immigrants from Iran | Panamanian |
| Minimum | 0.87% | 0.51% |
| Maximum | 7.8% | 16.7% |
| Range | 6.9% | 16.2% |
| Mean | 4.0% | 6.6% |
| Median | 3.9% | 6.9% |
| Interquartile 25% (IQ1) | 3.2% | 3.7% |
| Interquartile 75% (IQ3) | 4.7% | 7.9% |
| Interquartile Range (IQR) | 1.5% | 4.2% |
| Standard Deviation (Sample) | 1.5% | 3.5% |
| Standard Deviation (Population) | 1.5% | 3.5% |
Similar Demographics by Single Mother Households
Demographics Similar to Immigrants from Iran by Single Mother Households
In terms of single mother households, the demographic groups most similar to Immigrants from Iran are Assyrian/Chaldean/Syriac (4.8%, a difference of 0.080%), Immigrants from Hong Kong (4.8%, a difference of 0.60%), Filipino (4.7%, a difference of 2.3%), Immigrants from Taiwan (4.7%, a difference of 2.6%), and Immigrants from Singapore (5.0%, a difference of 3.2%).
| Demographics | Rating | Rank | Single Mother Households |
| Immigrants | Taiwan | 100.0 /100 | #1 | Exceptional 4.7% |
| Filipinos | 100.0 /100 | #2 | Exceptional 4.7% |
| Immigrants | Iran | 100.0 /100 | #3 | Exceptional 4.8% |
| Assyrians/Chaldeans/Syriacs | 100.0 /100 | #4 | Exceptional 4.8% |
| Immigrants | Hong Kong | 100.0 /100 | #5 | Exceptional 4.8% |
| Immigrants | Singapore | 100.0 /100 | #6 | Exceptional 5.0% |
| Iranians | 100.0 /100 | #7 | Exceptional 5.0% |
| Immigrants | Ireland | 99.9 /100 | #8 | Exceptional 5.0% |
| Okinawans | 99.9 /100 | #9 | Exceptional 5.0% |
| Immigrants | Israel | 99.9 /100 | #10 | Exceptional 5.0% |
| Immigrants | China | 99.9 /100 | #11 | Exceptional 5.1% |
| Cypriots | 99.9 /100 | #12 | Exceptional 5.1% |
| Immigrants | India | 99.9 /100 | #13 | Exceptional 5.1% |
| Immigrants | Australia | 99.9 /100 | #14 | Exceptional 5.1% |
| Immigrants | Eastern Asia | 99.9 /100 | #15 | Exceptional 5.1% |
Demographics Similar to Panamanians by Single Mother Households
In terms of single mother households, the demographic groups most similar to Panamanians are Arapaho (7.1%, a difference of 0.14%), Ute (7.1%, a difference of 0.23%), Kiowa (7.1%, a difference of 0.27%), Immigrants from Panama (7.2%, a difference of 0.59%), and Immigrants from Portugal (7.2%, a difference of 0.94%).
| Demographics | Rating | Rank | Single Mother Households |
| Spanish Americans | 1.6 /100 | #231 | Tragic 7.0% |
| Comanche | 1.5 /100 | #232 | Tragic 7.0% |
| Choctaw | 1.4 /100 | #233 | Tragic 7.0% |
| Chickasaw | 1.4 /100 | #234 | Tragic 7.0% |
| Immigrants | Burma/Myanmar | 1.4 /100 | #235 | Tragic 7.0% |
| Ute | 1.0 /100 | #236 | Tragic 7.1% |
| Arapaho | 1.0 /100 | #237 | Tragic 7.1% |
| Panamanians | 0.9 /100 | #238 | Tragic 7.1% |
| Kiowa | 0.8 /100 | #239 | Tragic 7.1% |
| Immigrants | Panama | 0.7 /100 | #240 | Tragic 7.2% |
| Immigrants | Portugal | 0.6 /100 | #241 | Tragic 7.2% |
| Fijians | 0.6 /100 | #242 | Tragic 7.2% |
| Ecuadorians | 0.6 /100 | #243 | Tragic 7.2% |
| Cubans | 0.6 /100 | #244 | Tragic 7.2% |
| Immigrants | Cambodia | 0.5 /100 | #245 | Tragic 7.2% |