Immigrants from Northern Europe vs Aleut Single Father Households
COMPARE
Immigrants from Northern Europe
Aleut
Single Father Households
Single Father Households Comparison
Immigrants from Northern Europe
Aleuts
2.0%
SINGLE FATHER HOUSEHOLDS
99.9/ 100
METRIC RATING
53rd/ 347
METRIC RANK
3.0%
SINGLE FATHER HOUSEHOLDS
0.0/ 100
METRIC RATING
326th/ 347
METRIC RANK
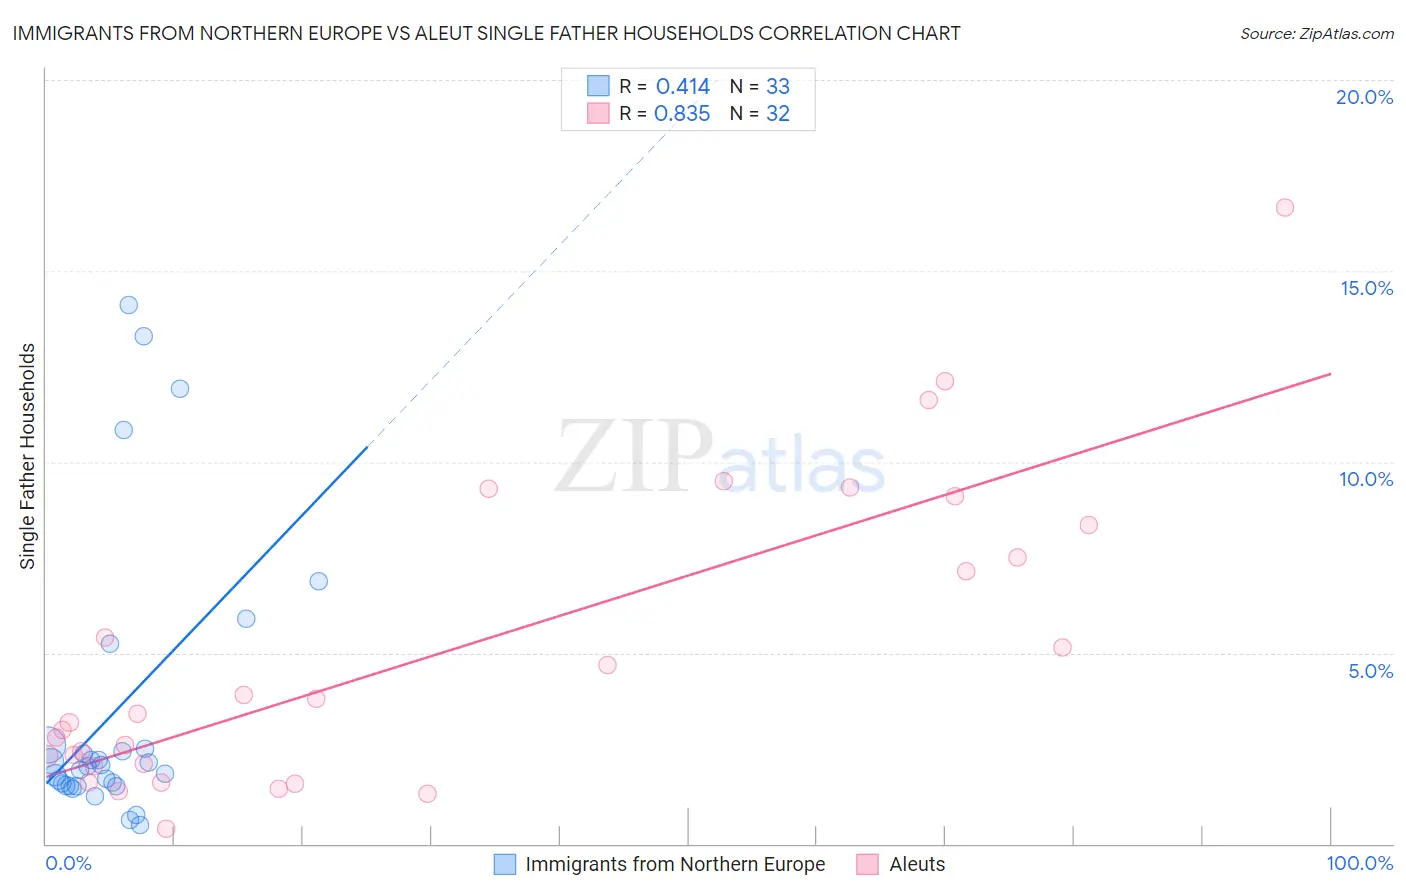
Immigrants from Northern Europe vs Aleut Single Father Households Correlation Chart
The statistical analysis conducted on geographies consisting of 470,222,953 people shows a moderate positive correlation between the proportion of Immigrants from Northern Europe and percentage of single father households in the United States with a correlation coefficient (R) of 0.414 and weighted average of 2.0%. Similarly, the statistical analysis conducted on geographies consisting of 61,629,063 people shows a very strong positive correlation between the proportion of Aleuts and percentage of single father households in the United States with a correlation coefficient (R) of 0.835 and weighted average of 3.0%, a difference of 50.5%.
Single Father Households Correlation Summary
| Measurement | Immigrants from Northern Europe | Aleut |
| Minimum | 0.50% | 0.40% |
| Maximum | 14.1% | 16.7% |
| Range | 13.6% | 16.3% |
| Mean | 3.4% | 5.0% |
| Median | 2.0% | 3.3% |
| Interquartile 25% (IQ1) | 1.5% | 2.1% |
| Interquartile 75% (IQ3) | 2.5% | 7.9% |
| Interquartile Range (IQR) | 1.0% | 5.8% |
| Standard Deviation (Sample) | 3.7% | 4.0% |
| Standard Deviation (Population) | 3.7% | 3.9% |
Similar Demographics by Single Father Households
Demographics Similar to Immigrants from Northern Europe by Single Father Households
In terms of single father households, the demographic groups most similar to Immigrants from Northern Europe are Immigrants from Europe (2.0%, a difference of 0.13%), Immigrants from Korea (2.0%, a difference of 0.14%), Immigrants from France (2.0%, a difference of 0.20%), Immigrants from Norway (2.0%, a difference of 0.22%), and Immigrants from Serbia (2.0%, a difference of 0.38%).
| Demographics | Rating | Rank | Single Father Households |
| Immigrants | Lebanon | 100.0 /100 | #46 | Exceptional 2.0% |
| Immigrants | Ukraine | 99.9 /100 | #47 | Exceptional 2.0% |
| Immigrants | Kazakhstan | 99.9 /100 | #48 | Exceptional 2.0% |
| Immigrants | Serbia | 99.9 /100 | #49 | Exceptional 2.0% |
| Immigrants | Switzerland | 99.9 /100 | #50 | Exceptional 2.0% |
| Immigrants | Poland | 99.9 /100 | #51 | Exceptional 2.0% |
| Immigrants | Europe | 99.9 /100 | #52 | Exceptional 2.0% |
| Immigrants | Northern Europe | 99.9 /100 | #53 | Exceptional 2.0% |
| Immigrants | Korea | 99.9 /100 | #54 | Exceptional 2.0% |
| Immigrants | France | 99.9 /100 | #55 | Exceptional 2.0% |
| Immigrants | Norway | 99.9 /100 | #56 | Exceptional 2.0% |
| Burmese | 99.9 /100 | #57 | Exceptional 2.0% |
| Immigrants | Czechoslovakia | 99.9 /100 | #58 | Exceptional 2.0% |
| Immigrants | North Macedonia | 99.9 /100 | #59 | Exceptional 2.0% |
| Immigrants | Austria | 99.9 /100 | #60 | Exceptional 2.0% |
Demographics Similar to Aleuts by Single Father Households
In terms of single father households, the demographic groups most similar to Aleuts are Immigrants from Mexico (3.0%, a difference of 0.19%), Bangladeshi (3.1%, a difference of 0.88%), Fijian (3.0%, a difference of 1.4%), Immigrants from Cabo Verde (3.1%, a difference of 1.4%), and Immigrants from Central America (3.0%, a difference of 1.5%).
| Demographics | Rating | Rank | Single Father Households |
| Ute | 0.0 /100 | #319 | Tragic 3.0% |
| Guatemalans | 0.0 /100 | #320 | Tragic 3.0% |
| Mexicans | 0.0 /100 | #321 | Tragic 3.0% |
| Immigrants | Guatemala | 0.0 /100 | #322 | Tragic 3.0% |
| Immigrants | Central America | 0.0 /100 | #323 | Tragic 3.0% |
| Fijians | 0.0 /100 | #324 | Tragic 3.0% |
| Immigrants | Mexico | 0.0 /100 | #325 | Tragic 3.0% |
| Aleuts | 0.0 /100 | #326 | Tragic 3.0% |
| Bangladeshis | 0.0 /100 | #327 | Tragic 3.1% |
| Immigrants | Cabo Verde | 0.0 /100 | #328 | Tragic 3.1% |
| Chippewa | 0.0 /100 | #329 | Tragic 3.1% |
| Nepalese | 0.0 /100 | #330 | Tragic 3.1% |
| Navajo | 0.0 /100 | #331 | Tragic 3.2% |
| Yaqui | 0.0 /100 | #332 | Tragic 3.2% |
| Natives/Alaskans | 0.0 /100 | #333 | Tragic 3.2% |