Belgian vs Canadian Single Father Households
COMPARE
Belgian
Canadian
Single Father Households
Single Father Households Comparison
Belgians
Canadians
2.3%
SINGLE FATHER HOUSEHOLDS
43.3/ 100
METRIC RATING
182nd/ 347
METRIC RANK
2.3%
SINGLE FATHER HOUSEHOLDS
79.7/ 100
METRIC RATING
157th/ 347
METRIC RANK
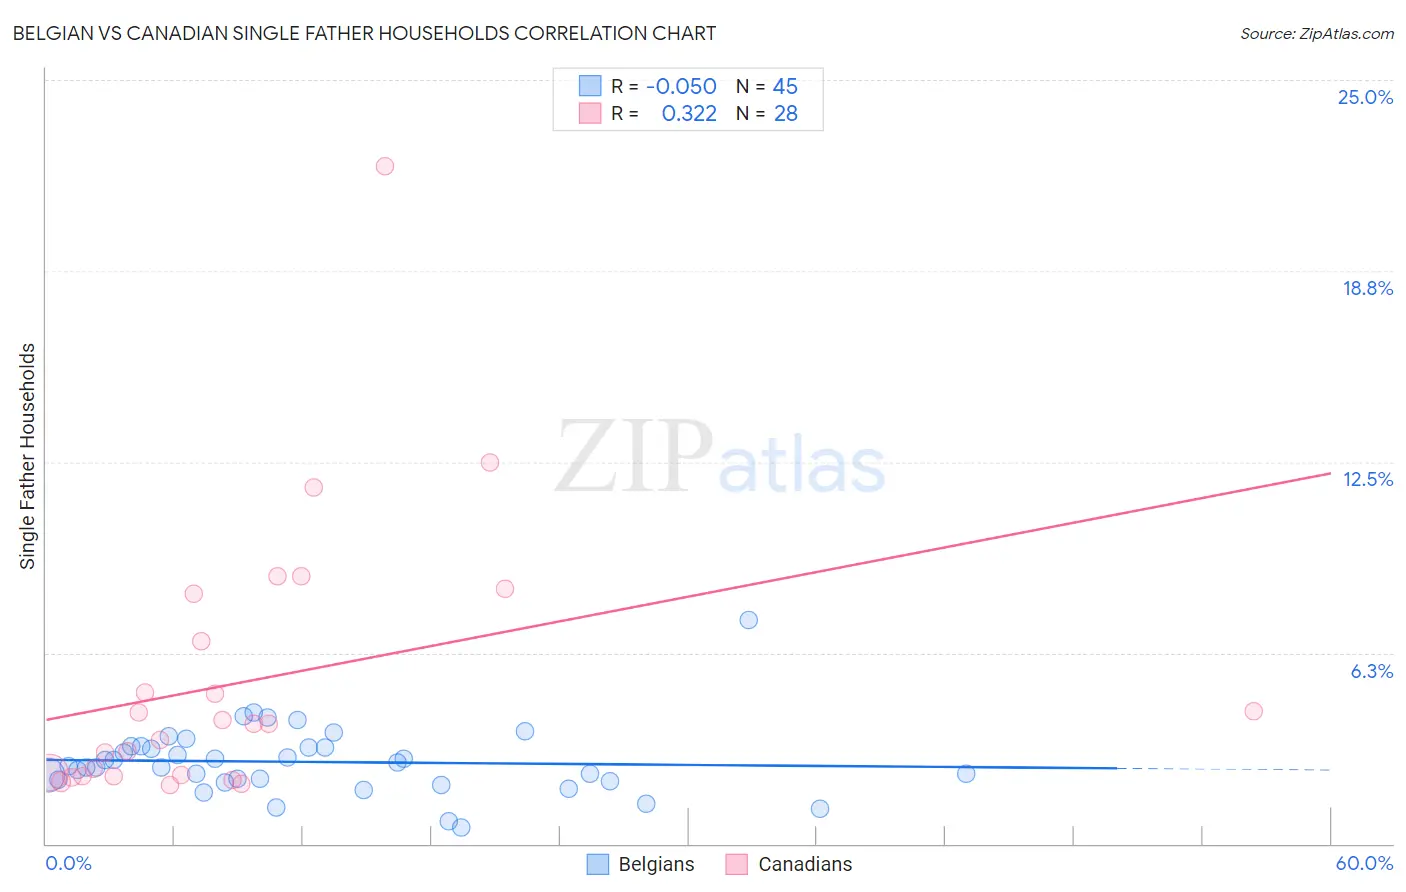
Belgian vs Canadian Single Father Households Correlation Chart
The statistical analysis conducted on geographies consisting of 352,865,149 people shows a slight negative correlation between the proportion of Belgians and percentage of single father households in the United States with a correlation coefficient (R) of -0.050 and weighted average of 2.3%. Similarly, the statistical analysis conducted on geographies consisting of 432,424,973 people shows a mild positive correlation between the proportion of Canadians and percentage of single father households in the United States with a correlation coefficient (R) of 0.322 and weighted average of 2.3%, a difference of 3.1%.
Single Father Households Correlation Summary
| Measurement | Belgian | Canadian |
| Minimum | 0.55% | 1.9% |
| Maximum | 7.3% | 22.2% |
| Range | 6.8% | 20.3% |
| Mean | 2.7% | 5.3% |
| Median | 2.5% | 3.9% |
| Interquartile 25% (IQ1) | 2.1% | 2.2% |
| Interquartile 75% (IQ3) | 3.2% | 7.4% |
| Interquartile Range (IQR) | 1.1% | 5.2% |
| Standard Deviation (Sample) | 1.1% | 4.5% |
| Standard Deviation (Population) | 1.1% | 4.4% |
Similar Demographics by Single Father Households
Demographics Similar to Belgians by Single Father Households
In terms of single father households, the demographic groups most similar to Belgians are Jamaican (2.3%, a difference of 0.020%), Yugoslavian (2.3%, a difference of 0.040%), Costa Rican (2.3%, a difference of 0.060%), Welsh (2.3%, a difference of 0.060%), and Immigrants from Panama (2.4%, a difference of 0.11%).
| Demographics | Rating | Rank | Single Father Households |
| Immigrants | Jamaica | 49.1 /100 | #175 | Average 2.3% |
| Danes | 48.2 /100 | #176 | Average 2.3% |
| Colombians | 48.0 /100 | #177 | Average 2.3% |
| Costa Ricans | 44.1 /100 | #178 | Average 2.3% |
| Welsh | 44.0 /100 | #179 | Average 2.3% |
| Yugoslavians | 43.9 /100 | #180 | Average 2.3% |
| Jamaicans | 43.5 /100 | #181 | Average 2.3% |
| Belgians | 43.3 /100 | #182 | Average 2.3% |
| Immigrants | Panama | 41.8 /100 | #183 | Average 2.4% |
| Sri Lankans | 41.8 /100 | #184 | Average 2.4% |
| Nigerians | 41.0 /100 | #185 | Average 2.4% |
| Immigrants | Bosnia and Herzegovina | 40.4 /100 | #186 | Average 2.4% |
| Immigrants | Colombia | 34.0 /100 | #187 | Fair 2.4% |
| Hmong | 33.0 /100 | #188 | Fair 2.4% |
| U.S. Virgin Islanders | 31.8 /100 | #189 | Fair 2.4% |
Demographics Similar to Canadians by Single Father Households
In terms of single father households, the demographic groups most similar to Canadians are Immigrants from South America (2.3%, a difference of 0.020%), Immigrants from Senegal (2.3%, a difference of 0.030%), European (2.3%, a difference of 0.14%), Bolivian (2.3%, a difference of 0.16%), and Immigrants from West Indies (2.3%, a difference of 0.20%).
| Demographics | Rating | Rank | Single Father Households |
| Venezuelans | 86.2 /100 | #150 | Excellent 2.3% |
| Immigrants | Syria | 84.8 /100 | #151 | Excellent 2.3% |
| Immigrants | Venezuela | 83.2 /100 | #152 | Excellent 2.3% |
| Immigrants | Germany | 82.8 /100 | #153 | Excellent 2.3% |
| Bolivians | 81.0 /100 | #154 | Excellent 2.3% |
| Europeans | 80.9 /100 | #155 | Excellent 2.3% |
| Immigrants | South America | 79.9 /100 | #156 | Good 2.3% |
| Canadians | 79.7 /100 | #157 | Good 2.3% |
| Immigrants | Senegal | 79.4 /100 | #158 | Good 2.3% |
| Immigrants | West Indies | 77.9 /100 | #159 | Good 2.3% |
| Immigrants | Bolivia | 76.3 /100 | #160 | Good 2.3% |
| Swiss | 73.2 /100 | #161 | Good 2.3% |
| Scottish | 72.8 /100 | #162 | Good 2.3% |
| Irish | 72.1 /100 | #163 | Good 2.3% |
| Pakistanis | 70.6 /100 | #164 | Good 2.3% |