Basque vs Sudanese 3rd Grade
COMPARE
Basque
Sudanese
3rd Grade
3rd Grade Comparison
Basques
Sudanese
98.0%
3RD GRADE
96.5/ 100
METRIC RATING
111th/ 347
METRIC RANK
97.5%
3RD GRADE
4.1/ 100
METRIC RATING
226th/ 347
METRIC RANK
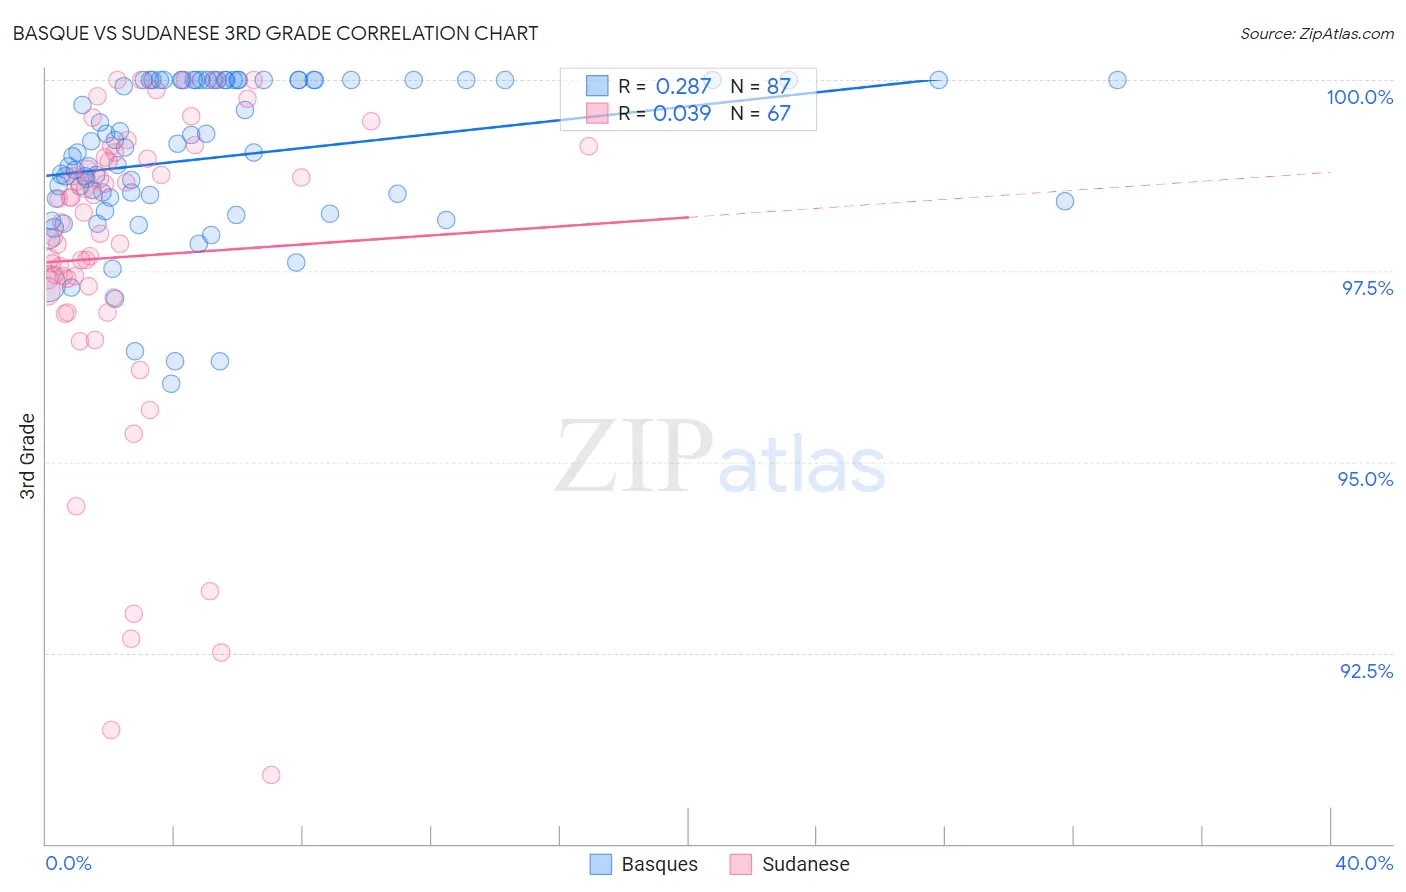
Basque vs Sudanese 3rd Grade Correlation Chart
The statistical analysis conducted on geographies consisting of 165,774,137 people shows a weak positive correlation between the proportion of Basques and percentage of population with at least 3rd grade education in the United States with a correlation coefficient (R) of 0.287 and weighted average of 98.0%. Similarly, the statistical analysis conducted on geographies consisting of 110,145,984 people shows no correlation between the proportion of Sudanese and percentage of population with at least 3rd grade education in the United States with a correlation coefficient (R) of 0.039 and weighted average of 97.5%, a difference of 0.55%.
3rd Grade Correlation Summary
| Measurement | Basque | Sudanese |
| Minimum | 96.0% | 90.9% |
| Maximum | 100.0% | 100.0% |
| Range | 4.0% | 9.1% |
| Mean | 99.0% | 97.7% |
| Median | 99.1% | 98.1% |
| Interquartile 25% (IQ1) | 98.4% | 97.2% |
| Interquartile 75% (IQ3) | 100.0% | 99.0% |
| Interquartile Range (IQR) | 1.6% | 1.8% |
| Standard Deviation (Sample) | 1.0% | 2.1% |
| Standard Deviation (Population) | 1.0% | 2.1% |
Similar Demographics by 3rd Grade
Demographics Similar to Basques by 3rd Grade
In terms of 3rd grade, the demographic groups most similar to Basques are Immigrants from Switzerland (98.0%, a difference of 0.0%), Immigrants from Czechoslovakia (98.0%, a difference of 0.010%), Immigrants from Singapore (98.0%, a difference of 0.010%), Pima (98.0%, a difference of 0.010%), and Immigrants from Latvia (98.0%, a difference of 0.010%).
| Demographics | Rating | Rank | 3rd Grade |
| Turks | 97.6 /100 | #104 | Exceptional 98.1% |
| German Russians | 97.2 /100 | #105 | Exceptional 98.1% |
| Bhutanese | 97.2 /100 | #106 | Exceptional 98.1% |
| Immigrants | Czechoslovakia | 97.0 /100 | #107 | Exceptional 98.0% |
| Immigrants | Singapore | 96.7 /100 | #108 | Exceptional 98.0% |
| Pima | 96.7 /100 | #109 | Exceptional 98.0% |
| Immigrants | Switzerland | 96.6 /100 | #110 | Exceptional 98.0% |
| Basques | 96.5 /100 | #111 | Exceptional 98.0% |
| Immigrants | Latvia | 96.0 /100 | #112 | Exceptional 98.0% |
| Thais | 95.5 /100 | #113 | Exceptional 98.0% |
| Menominee | 95.4 /100 | #114 | Exceptional 98.0% |
| Okinawans | 95.2 /100 | #115 | Exceptional 98.0% |
| Immigrants | Norway | 95.2 /100 | #116 | Exceptional 98.0% |
| Immigrants | France | 95.1 /100 | #117 | Exceptional 98.0% |
| Iranians | 94.9 /100 | #118 | Exceptional 98.0% |
Demographics Similar to Sudanese by 3rd Grade
In terms of 3rd grade, the demographic groups most similar to Sudanese are Tongan (97.5%, a difference of 0.0%), Sierra Leonean (97.5%, a difference of 0.010%), Immigrants from Syria (97.5%, a difference of 0.010%), Bahamian (97.5%, a difference of 0.010%), and Immigrants from Panama (97.5%, a difference of 0.020%).
| Demographics | Rating | Rank | 3rd Grade |
| Immigrants | Panama | 5.2 /100 | #219 | Tragic 97.5% |
| Immigrants | Morocco | 5.0 /100 | #220 | Tragic 97.5% |
| Uruguayans | 5.0 /100 | #221 | Tragic 97.5% |
| Sierra Leoneans | 4.6 /100 | #222 | Tragic 97.5% |
| Immigrants | Syria | 4.4 /100 | #223 | Tragic 97.5% |
| Bahamians | 4.4 /100 | #224 | Tragic 97.5% |
| Tongans | 4.3 /100 | #225 | Tragic 97.5% |
| Sudanese | 4.1 /100 | #226 | Tragic 97.5% |
| Immigrants | Sudan | 3.4 /100 | #227 | Tragic 97.5% |
| Sub-Saharan Africans | 3.2 /100 | #228 | Tragic 97.5% |
| Senegalese | 3.0 /100 | #229 | Tragic 97.5% |
| Immigrants | Pakistan | 2.7 /100 | #230 | Tragic 97.5% |
| Immigrants | Costa Rica | 2.7 /100 | #231 | Tragic 97.5% |
| Immigrants | Western Asia | 2.6 /100 | #232 | Tragic 97.5% |
| Immigrants | Malaysia | 2.4 /100 | #233 | Tragic 97.5% |