Immigrants from Singapore vs Sudanese Family Households
COMPARE
Immigrants from Singapore
Sudanese
Family Households
Family Households Comparison
Immigrants from Singapore
Sudanese
63.1%
FAMILY HOUSEHOLDS
0.4/ 100
METRIC RATING
268th/ 347
METRIC RANK
60.0%
FAMILY HOUSEHOLDS
0.0/ 100
METRIC RATING
342nd/ 347
METRIC RANK
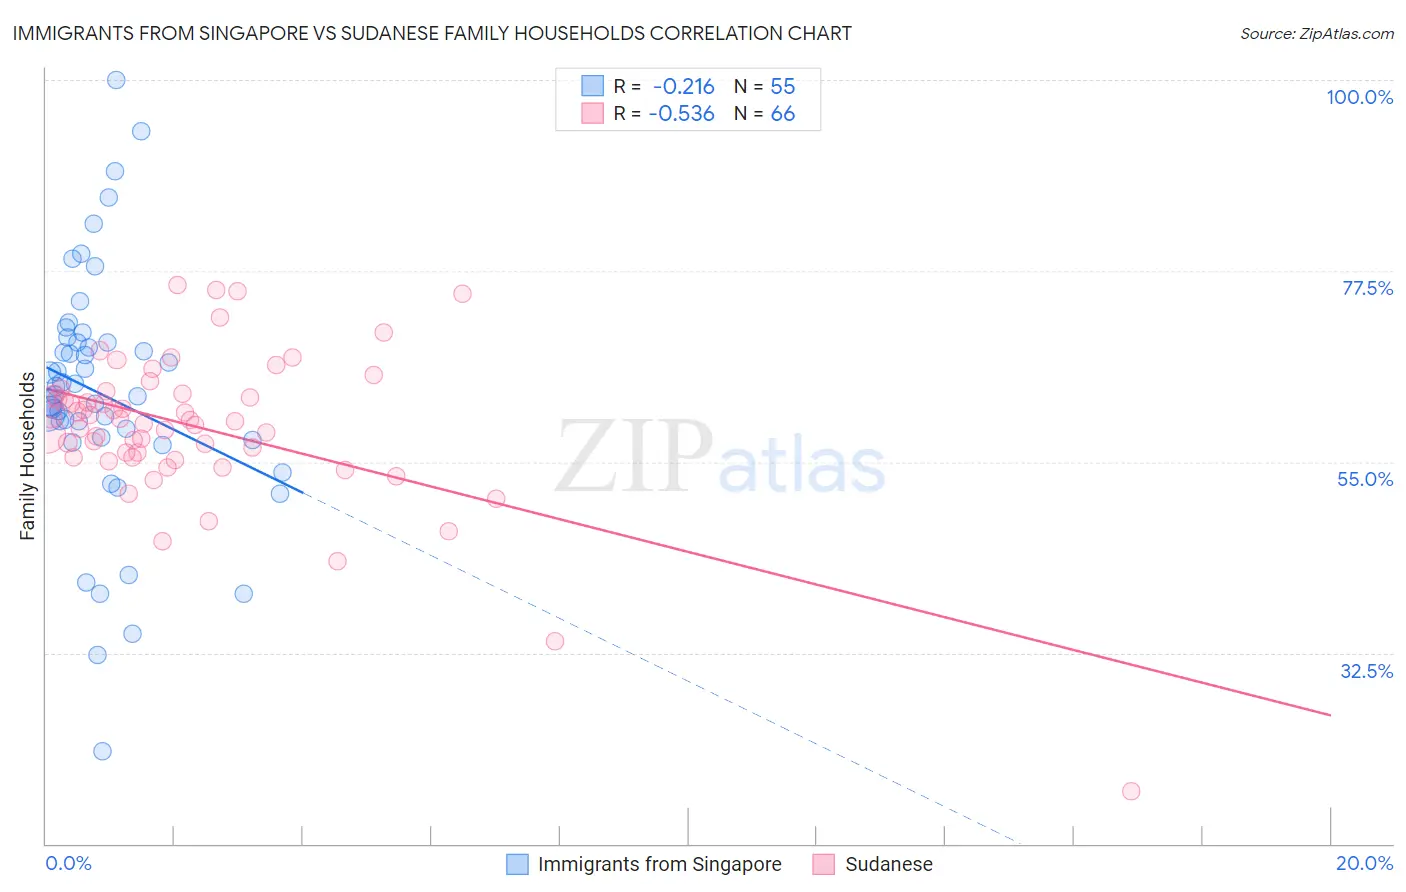
Immigrants from Singapore vs Sudanese Family Households Correlation Chart
The statistical analysis conducted on geographies consisting of 137,456,675 people shows a weak negative correlation between the proportion of Immigrants from Singapore and percentage of family households in the United States with a correlation coefficient (R) of -0.216 and weighted average of 63.1%. Similarly, the statistical analysis conducted on geographies consisting of 110,109,646 people shows a substantial negative correlation between the proportion of Sudanese and percentage of family households in the United States with a correlation coefficient (R) of -0.536 and weighted average of 60.0%, a difference of 5.1%.
Family Households Correlation Summary
| Measurement | Immigrants from Singapore | Sudanese |
| Minimum | 20.9% | 16.3% |
| Maximum | 100.0% | 75.8% |
| Range | 79.1% | 59.6% |
| Mean | 62.9% | 59.1% |
| Median | 62.9% | 59.9% |
| Interquartile 25% (IQ1) | 57.5% | 55.6% |
| Interquartile 75% (IQ3) | 69.0% | 63.0% |
| Interquartile Range (IQR) | 11.5% | 7.4% |
| Standard Deviation (Sample) | 14.6% | 9.2% |
| Standard Deviation (Population) | 14.5% | 9.1% |
Similar Demographics by Family Households
Demographics Similar to Immigrants from Singapore by Family Households
In terms of family households, the demographic groups most similar to Immigrants from Singapore are Yugoslavian (63.1%, a difference of 0.0%), Immigrants from Austria (63.1%, a difference of 0.020%), Immigrants from Croatia (63.1%, a difference of 0.030%), Immigrants from Turkey (63.1%, a difference of 0.030%), and Immigrants from Kazakhstan (63.1%, a difference of 0.040%).
| Demographics | Rating | Rank | Family Households |
| Immigrants | Russia | 0.6 /100 | #261 | Tragic 63.2% |
| Immigrants | Ireland | 0.6 /100 | #262 | Tragic 63.2% |
| Cheyenne | 0.5 /100 | #263 | Tragic 63.2% |
| Kenyans | 0.5 /100 | #264 | Tragic 63.2% |
| Colville | 0.5 /100 | #265 | Tragic 63.2% |
| Immigrants | Western Africa | 0.5 /100 | #266 | Tragic 63.1% |
| Israelis | 0.4 /100 | #267 | Tragic 63.1% |
| Immigrants | Singapore | 0.4 /100 | #268 | Tragic 63.1% |
| Yugoslavians | 0.4 /100 | #269 | Tragic 63.1% |
| Immigrants | Austria | 0.3 /100 | #270 | Tragic 63.1% |
| Immigrants | Croatia | 0.3 /100 | #271 | Tragic 63.1% |
| Immigrants | Turkey | 0.3 /100 | #272 | Tragic 63.1% |
| Immigrants | Kazakhstan | 0.3 /100 | #273 | Tragic 63.1% |
| Lumbee | 0.3 /100 | #274 | Tragic 63.1% |
| West Indians | 0.3 /100 | #275 | Tragic 63.1% |
Demographics Similar to Sudanese by Family Households
In terms of family households, the demographic groups most similar to Sudanese are Immigrants from Senegal (60.1%, a difference of 0.18%), Immigrants from Sudan (60.2%, a difference of 0.27%), Senegalese (59.8%, a difference of 0.30%), Immigrants from Saudi Arabia (60.7%, a difference of 1.2%), and Immigrants from Congo (59.2%, a difference of 1.3%).
| Demographics | Rating | Rank | Family Households |
| Immigrants | Ethiopia | 0.0 /100 | #333 | Tragic 61.2% |
| Immigrants | Eastern Africa | 0.0 /100 | #334 | Tragic 61.1% |
| Carpatho Rusyns | 0.0 /100 | #335 | Tragic 61.1% |
| German Russians | 0.0 /100 | #336 | Tragic 60.9% |
| Soviet Union | 0.0 /100 | #337 | Tragic 60.9% |
| Immigrants | Eritrea | 0.0 /100 | #338 | Tragic 60.8% |
| Immigrants | Saudi Arabia | 0.0 /100 | #339 | Tragic 60.7% |
| Immigrants | Sudan | 0.0 /100 | #340 | Tragic 60.2% |
| Immigrants | Senegal | 0.0 /100 | #341 | Tragic 60.1% |
| Sudanese | 0.0 /100 | #342 | Tragic 60.0% |
| Senegalese | 0.0 /100 | #343 | Tragic 59.8% |
| Immigrants | Congo | 0.0 /100 | #344 | Tragic 59.2% |
| Immigrants | Zaire | 0.0 /100 | #345 | Tragic 59.2% |
| Somalis | 0.0 /100 | #346 | Tragic 57.6% |
| Immigrants | Somalia | 0.0 /100 | #347 | Tragic 56.7% |