Pima vs New Zealander Single Mother Households
COMPARE
Pima
New Zealander
Single Mother Households
Single Mother Households Comparison
Pima
New Zealanders
8.3%
SINGLE MOTHER HOUSEHOLDS
0.0/ 100
METRIC RATING
322nd/ 347
METRIC RANK
5.6%
SINGLE MOTHER HOUSEHOLDS
98.2/ 100
METRIC RATING
76th/ 347
METRIC RANK
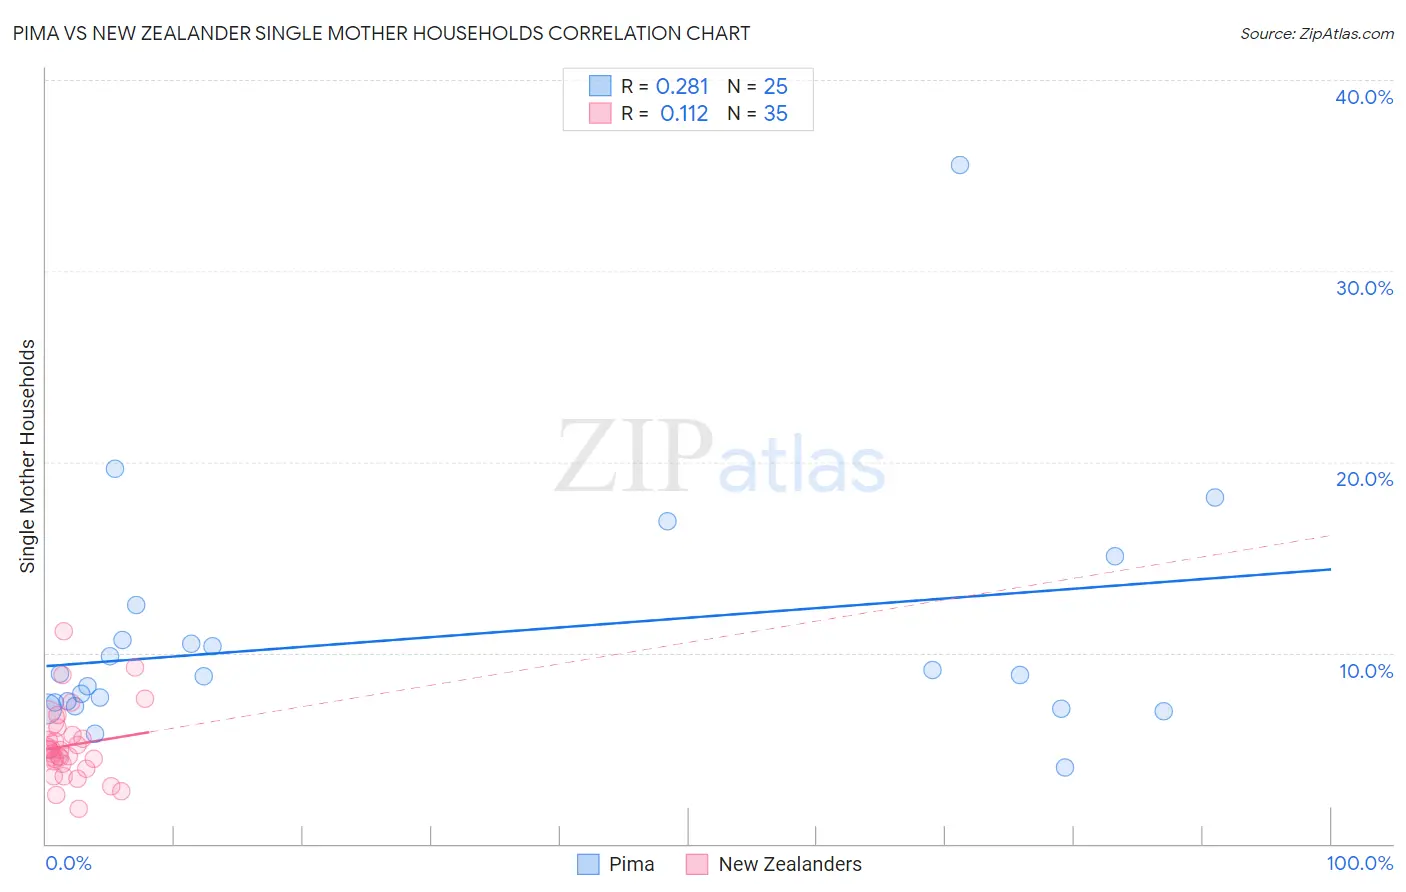
Pima vs New Zealander Single Mother Households Correlation Chart
The statistical analysis conducted on geographies consisting of 61,448,407 people shows a weak positive correlation between the proportion of Pima and percentage of single mother households in the United States with a correlation coefficient (R) of 0.281 and weighted average of 8.3%. Similarly, the statistical analysis conducted on geographies consisting of 106,839,899 people shows a poor positive correlation between the proportion of New Zealanders and percentage of single mother households in the United States with a correlation coefficient (R) of 0.112 and weighted average of 5.6%, a difference of 47.4%.
Single Mother Households Correlation Summary
| Measurement | Pima | New Zealander |
| Minimum | 4.0% | 1.8% |
| Maximum | 35.5% | 11.2% |
| Range | 31.6% | 9.3% |
| Mean | 10.9% | 5.2% |
| Median | 8.8% | 4.9% |
| Interquartile 25% (IQ1) | 7.3% | 4.2% |
| Interquartile 75% (IQ3) | 11.6% | 5.7% |
| Interquartile Range (IQR) | 4.3% | 1.5% |
| Standard Deviation (Sample) | 6.4% | 1.9% |
| Standard Deviation (Population) | 6.3% | 1.9% |
Similar Demographics by Single Mother Households
Demographics Similar to Pima by Single Mother Households
In terms of single mother households, the demographic groups most similar to Pima are Immigrants from Senegal (8.3%, a difference of 0.080%), Bahamian (8.3%, a difference of 0.32%), Jamaican (8.2%, a difference of 0.44%), Haitian (8.3%, a difference of 0.53%), and Senegalese (8.2%, a difference of 0.55%).
| Demographics | Rating | Rank | Single Mother Households |
| Immigrants | Western Africa | 0.0 /100 | #315 | Tragic 8.2% |
| Africans | 0.0 /100 | #316 | Tragic 8.2% |
| Immigrants | Honduras | 0.0 /100 | #317 | Tragic 8.2% |
| Senegalese | 0.0 /100 | #318 | Tragic 8.2% |
| Jamaicans | 0.0 /100 | #319 | Tragic 8.2% |
| Bahamians | 0.0 /100 | #320 | Tragic 8.3% |
| Immigrants | Senegal | 0.0 /100 | #321 | Tragic 8.3% |
| Pima | 0.0 /100 | #322 | Tragic 8.3% |
| Haitians | 0.0 /100 | #323 | Tragic 8.3% |
| Immigrants | Jamaica | 0.0 /100 | #324 | Tragic 8.4% |
| Immigrants | Caribbean | 0.0 /100 | #325 | Tragic 8.4% |
| British West Indians | 0.0 /100 | #326 | Tragic 8.4% |
| Immigrants | Haiti | 0.0 /100 | #327 | Tragic 8.4% |
| Yakama | 0.0 /100 | #328 | Tragic 8.4% |
| Hopi | 0.0 /100 | #329 | Tragic 8.5% |
Demographics Similar to New Zealanders by Single Mother Households
In terms of single mother households, the demographic groups most similar to New Zealanders are Slovene (5.6%, a difference of 0.070%), Romanian (5.6%, a difference of 0.19%), Swiss (5.6%, a difference of 0.19%), Immigrants from North America (5.6%, a difference of 0.21%), and Immigrants from Asia (5.6%, a difference of 0.24%).
| Demographics | Rating | Rank | Single Mother Households |
| Asians | 98.5 /100 | #69 | Exceptional 5.6% |
| Immigrants | Eastern Europe | 98.4 /100 | #70 | Exceptional 5.6% |
| Immigrants | Kazakhstan | 98.4 /100 | #71 | Exceptional 5.6% |
| Immigrants | Netherlands | 98.4 /100 | #72 | Exceptional 5.6% |
| Immigrants | Asia | 98.4 /100 | #73 | Exceptional 5.6% |
| Immigrants | North America | 98.3 /100 | #74 | Exceptional 5.6% |
| Slovenes | 98.3 /100 | #75 | Exceptional 5.6% |
| New Zealanders | 98.2 /100 | #76 | Exceptional 5.6% |
| Romanians | 98.1 /100 | #77 | Exceptional 5.6% |
| Swiss | 98.1 /100 | #78 | Exceptional 5.6% |
| Immigrants | Sri Lanka | 98.0 /100 | #79 | Exceptional 5.6% |
| Czechs | 97.9 /100 | #80 | Exceptional 5.6% |
| Immigrants | Moldova | 97.9 /100 | #81 | Exceptional 5.6% |
| Immigrants | Malaysia | 97.8 /100 | #82 | Exceptional 5.7% |
| Immigrants | Hungary | 97.8 /100 | #83 | Exceptional 5.7% |