Greek vs New Zealander Single Mother Households
COMPARE
Greek
New Zealander
Single Mother Households
Single Mother Households Comparison
Greeks
New Zealanders
5.6%
SINGLE MOTHER HOUSEHOLDS
98.6/ 100
METRIC RATING
65th/ 347
METRIC RANK
5.6%
SINGLE MOTHER HOUSEHOLDS
98.2/ 100
METRIC RATING
76th/ 347
METRIC RANK
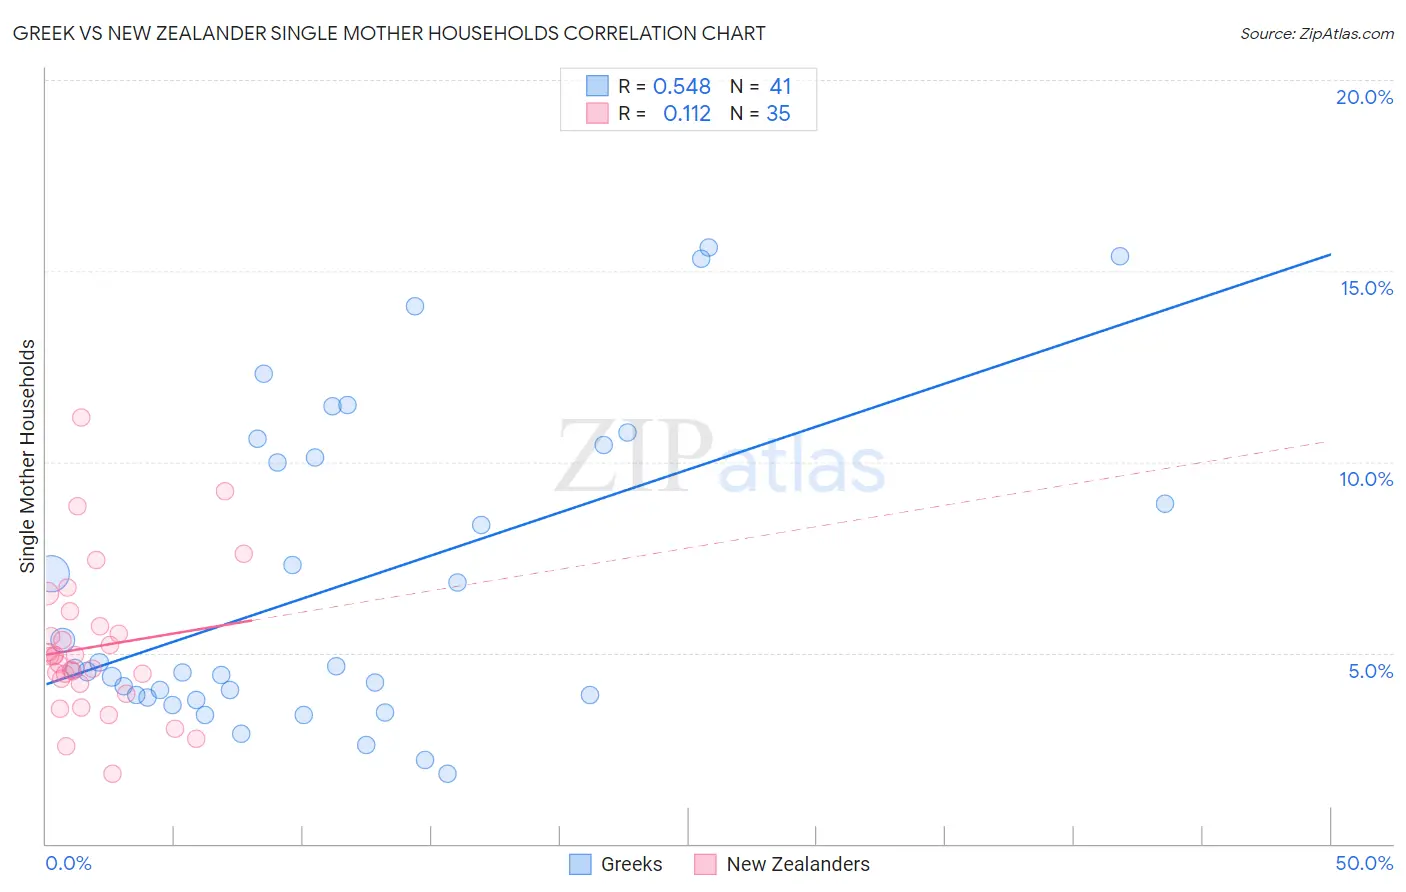
Greek vs New Zealander Single Mother Households Correlation Chart
The statistical analysis conducted on geographies consisting of 480,310,145 people shows a substantial positive correlation between the proportion of Greeks and percentage of single mother households in the United States with a correlation coefficient (R) of 0.548 and weighted average of 5.6%. Similarly, the statistical analysis conducted on geographies consisting of 106,839,899 people shows a poor positive correlation between the proportion of New Zealanders and percentage of single mother households in the United States with a correlation coefficient (R) of 0.112 and weighted average of 5.6%, a difference of 0.69%.
Single Mother Households Correlation Summary
| Measurement | Greek | New Zealander |
| Minimum | 1.8% | 1.8% |
| Maximum | 15.6% | 11.2% |
| Range | 13.8% | 9.3% |
| Mean | 6.8% | 5.2% |
| Median | 4.6% | 4.9% |
| Interquartile 25% (IQ1) | 3.9% | 4.2% |
| Interquartile 75% (IQ3) | 10.3% | 5.7% |
| Interquartile Range (IQR) | 6.4% | 1.5% |
| Standard Deviation (Sample) | 4.0% | 1.9% |
| Standard Deviation (Population) | 4.0% | 1.9% |
Demographics Similar to Greeks and New Zealanders by Single Mother Households
In terms of single mother households, the demographic groups most similar to Greeks are Immigrants from France (5.6%, a difference of 0.040%), Immigrants from North Macedonia (5.6%, a difference of 0.080%), Immigrants from Canada (5.6%, a difference of 0.10%), Italian (5.6%, a difference of 0.12%), and Polish (5.6%, a difference of 0.15%). Similarly, the demographic groups most similar to New Zealanders are Slovene (5.6%, a difference of 0.070%), Romanian (5.6%, a difference of 0.19%), Swiss (5.6%, a difference of 0.19%), Immigrants from North America (5.6%, a difference of 0.21%), and Immigrants from Asia (5.6%, a difference of 0.24%).
| Demographics | Rating | Rank | Single Mother Households |
| Immigrants | Norway | 98.7 /100 | #60 | Exceptional 5.6% |
| Australians | 98.7 /100 | #61 | Exceptional 5.6% |
| Poles | 98.6 /100 | #62 | Exceptional 5.6% |
| Immigrants | North Macedonia | 98.6 /100 | #63 | Exceptional 5.6% |
| Immigrants | France | 98.6 /100 | #64 | Exceptional 5.6% |
| Greeks | 98.6 /100 | #65 | Exceptional 5.6% |
| Immigrants | Canada | 98.5 /100 | #66 | Exceptional 5.6% |
| Italians | 98.5 /100 | #67 | Exceptional 5.6% |
| Immigrants | Bulgaria | 98.5 /100 | #68 | Exceptional 5.6% |
| Asians | 98.5 /100 | #69 | Exceptional 5.6% |
| Immigrants | Eastern Europe | 98.4 /100 | #70 | Exceptional 5.6% |
| Immigrants | Kazakhstan | 98.4 /100 | #71 | Exceptional 5.6% |
| Immigrants | Netherlands | 98.4 /100 | #72 | Exceptional 5.6% |
| Immigrants | Asia | 98.4 /100 | #73 | Exceptional 5.6% |
| Immigrants | North America | 98.3 /100 | #74 | Exceptional 5.6% |
| Slovenes | 98.3 /100 | #75 | Exceptional 5.6% |
| New Zealanders | 98.2 /100 | #76 | Exceptional 5.6% |
| Romanians | 98.1 /100 | #77 | Exceptional 5.6% |
| Swiss | 98.1 /100 | #78 | Exceptional 5.6% |
| Immigrants | Sri Lanka | 98.0 /100 | #79 | Exceptional 5.6% |
| Czechs | 97.9 /100 | #80 | Exceptional 5.6% |